

The following table shows the values of a certain clothing expenditure (Y), total expenditure (X1) and clothing
Fantastic news! We've Found the answer you've been seeking!
Question:
The following table shows the values of a certain clothing expenditure (Y), total expenditure (X1) and clothing price (X2) on an arbitrary unit basis, as well as the equation for the regression of the smallest times estimated from them
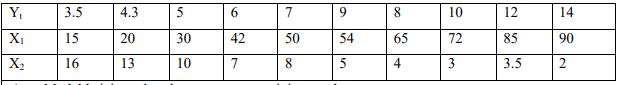
a) interpret the autocorelation parameter for the Model.
b) investigate the presence of autocorelation in the model with the Durbin –Watson Test at 0.05 error level.
c) interpret the change in clothing expenses.
Expert Answer:
Based on the provided data lets assume the table is structured as follows Y Clothing Expenditure X1 ... View the full answer

Related Book For 

Business Statistics In Practice
ISBN: 9780073401836
6th Edition
Authors: Bruce Bowerman, Richard O'Connell
Posted Date:
