

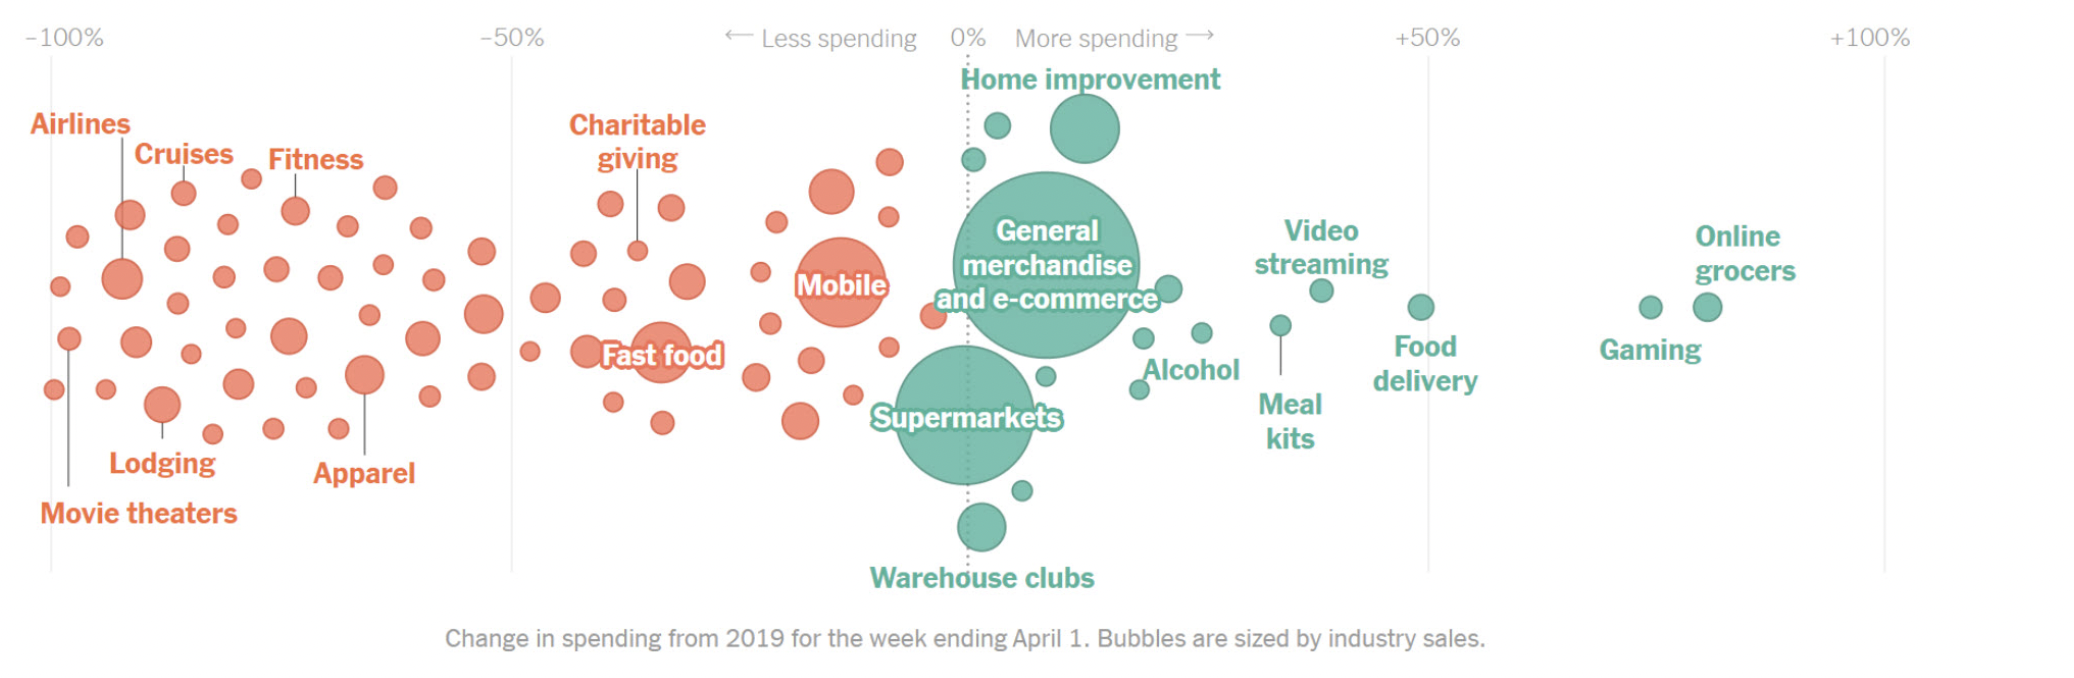
The graph below focuses on the percentage change in spending by buying category and on industry sales,
No answer yet for this question.
Ask a Tutor
Question:
The graph below focuses on the percentage change in spending by buying category and on industry sales, represented by bubble size. It shows the year-over-year (see below Stat Nugget) percentage change in credit and debit card purchases for nearly six million people in the U. S. for the week of March 26 through April 1, 2020, over the same week in 2019. Though the data are from a small fraction of the country's shoppers and do not include purchases made with cash, the data may be a reasonable gauge for what happened with spending habits immediately after COVID-19.
Expert Answer:

Related Book For 

Posted Date:
