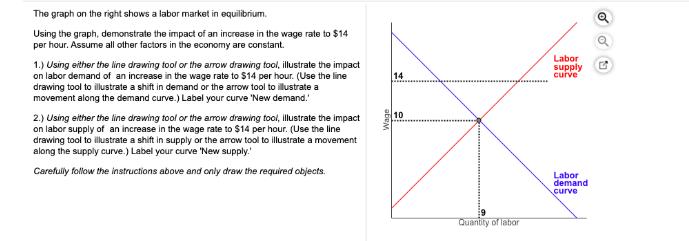
The graph on the right shows a labor market in equilibrium. Using the graph, demonstrate the...
Fantastic news! We've Found the answer you've been seeking!
Question:
Transcribed Image Text:
The graph on the right shows a labor market in equilibrium. Using the graph, demonstrate the impact of an increase in the wage rate to $14 per hour. Assume all other factors in the economy are constant. 1.) Using either the line drawing tool or the arrow drawing tool, illustrate the impact on labor demand of an increase in the wage rate to $14 per hour. (Use the line drawing tool to illustrate a shift in demand or the arrow tool to illustrate a movement along the demand curve.) Label your curve 'New demand.' 2.) Using either the line drawing tool or the arrow drawing tool, illustrate the impact on labor supply of an increase in the wage rate to $14 per hour. (Use the line drawing tool to illustrate a shift in supply or the arrow tool to illustrate a movement along the supply curve.) Label your curve 'New supply. Carefully follow the instructions above and only draw the required objects. Wage 14 10 Quantity of labor Labor supply curve Labor demand curve The graph on the right shows a labor market in equilibrium. Using the graph, demonstrate the impact of an increase in the wage rate to $14 per hour. Assume all other factors in the economy are constant. 1.) Using either the line drawing tool or the arrow drawing tool, illustrate the impact on labor demand of an increase in the wage rate to $14 per hour. (Use the line drawing tool to illustrate a shift in demand or the arrow tool to illustrate a movement along the demand curve.) Label your curve 'New demand.' 2.) Using either the line drawing tool or the arrow drawing tool, illustrate the impact on labor supply of an increase in the wage rate to $14 per hour. (Use the line drawing tool to illustrate a shift in supply or the arrow tool to illustrate a movement along the supply curve.) Label your curve 'New supply. Carefully follow the instructions above and only draw the required objects. Wage 14 10 Quantity of labor Labor supply curve Labor demand curve
Expert Answer:
Related Book For
Macroeconomics Principles and Applications
ISBN: 978-1133265238
5th edition
Authors: Robert e. hall, marc Lieberman
Posted Date:
Students also viewed these general management questions
-
In the United States, the semiconductor manufacturer illustrated in the figure to the right produces using capital and labor according to one of three technologies. 10- 1200 ten + layer chips per day...
-
The graph on the right shows the demand, marginal revenue, marginal cost, and average total cost curves for a monopolist. Show the impact if this firm was regulated to charge the socially optimal...
-
Gary Shapiro is the head of the Consumer Technology Association. In an opinion column in the Wall Street Journal, he argues that once people begin wearing micro-electrical-mechanical systems (MEMSS),...
-
Find dy/dx for the following functions. y = sin x + cos x
-
You recently ran into Bill Autograph, a friend from high school who has been busy getting his sports collectible/memorabilia business off the ground. When he heard you were an accountant, he became...
-
Uhura Company has decided to expand its operations. The bookkeeper recently completed the following balance sheet in order to obtain additional funds for expansion. Instructions Prepare a revised...
-
The auditor must audit other information in documents containing audited financial statements. Do you agree? Why or why not?
-
The average annual cost (including tuition, room, board, books, and fees) to attend a public college takes nearly a third of the annual income of a typical family with college age children (Money,...
-
The Unit 2 Assignment should respond substantively to the prompt below. The answers should reflect your own thought and not just repeat what is found in the readings. The essays should be...
-
1. The weights of all babies born at a hospital have a mean of 7.4 pounds and a standard deviation of 0.66 pounds. Assuming (n/N less than 0.05), the standard deviation of the sampling distribution...
-
As a Venture Capital investor, how would you evaluate Lovepop? Apply the POCD framework, by providing your perspective on the strengths and weaknesses of Lovepop through the perspective of People,...
-
Develop the optimization problem of a fluid flow system with two objectives, minimization of installation cost as well as minimization of pumping cost.
-
When marketing a good or service in a foreign market, the decision must be made about whether to standardize or adapt a product's marketing mix. Tencent Holdings Ltd., the world's largest mobile...
-
Want to improve your posture, align your balance and live your life? That's the ad campaign for SOLS, a $3 million company that makes custom 3D-printed orthotics, a custom-made insert or footbed...
-
Write down the algorithm for solving a multi-objective optimization problem using Lexicographic method.
-
Under what circumstances are companies likely to emphasize personal selling?
-
Unlike Illinois, the Village of Maple Park is located in a state in which property taxes are levied and collected in the same year. The information below pertains to the Village for the year ended...
-
On April 29, 2015, Auk Corporation acquires 100% of the outstanding stock of Amazon Corporation (E & P of $750,000) for $1.2 million. Amazon has assets with a fair market value of $1.4 million (basis...
-
Draw supply and demand diagrams for market A for each of the following. Then use your diagrams to illustrate the impact of the following events. In each case, determine what happens to price and...
-
Parvez, a pharmacology student, has allocated $120 per month to spend on paperback novels and used CDs. Novels cost $8 each; CDs cost $6 each. Draw his budget line. a. Draw and label a second budget...
-
Suppose that in the market for U.S. meat packers, two things happen simultaneously: (1) Due to growth in less-developed countries, the demand for U.S. meat exports rises; and (2) Due to other job...
-
Solve Chapter Problem 13.21, assuming the power spectral density is band limited with \(\omega_{1}=50 \mathrm{rad} / \mathrm{s}\) and \(\omega_{2}=200 \mathrm{rad} / \mathrm{s}\). Data From Chapter...
-
Solve Chapter Problem 13.21, assuming the force is narrowband with a power spectral density given by \(S_{F}(\omega)=\frac{3 \times 10^{-3}}{2+5 \omega^{2}}\). Data From Chapter Problem 13.21: A SDOF...
-
Fine Leather Ltd has provided the following production and sales information for each pair of its dress shoes. The fixed costs for the period are \($1\) 125 000. Required (a) Calculate the...
Study smarter with the SolutionInn App