

The graph plots investment goods (units per time) versus consumer goods (units per time). The plotted line
No answer yet for this question.
Ask a Tutor
Question:
The graph plots investment goods (units per time) versus consumer goods (units per time). The plotted line falls through the following points: (0, 9), (3, 8), (5, 7), (6, 6), (7, 4), (8, 0).
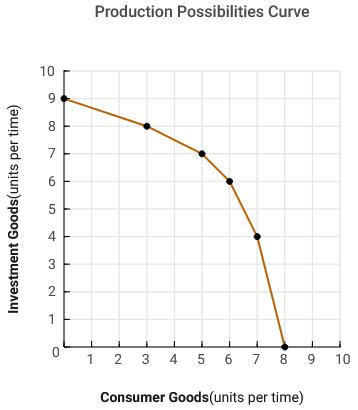
Use the figure above to answer the following questions.
What is the opportunity cost of increasing consumer goods from 3 units to 7 units?
What will happen to future production possibilities if investment decreases now?
What will happen to future production possibilities if only consumer goods are produced now?
Expert Answer:

Related Book For 

Statistics For Business And Economics
ISBN: 9780132745659
8th Edition
Authors: Paul Newbold, William Carlson, Betty Thorne
Posted Date:
