

The graph shows the depth of water W in a reservoir over a one-year period as a
No answer yet for this question.
Ask a Tutor
Question:
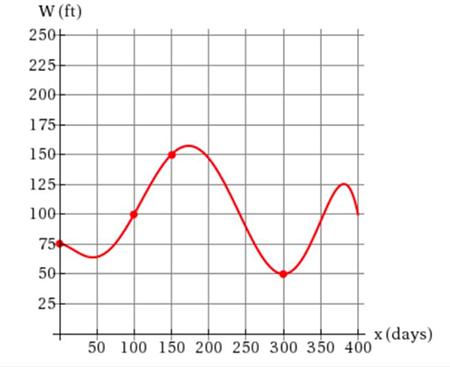
The graph shows the depth of water W in a reservoir over a one-year period as a function of the number of days x since the beginning of the year. What was the average rate of change of W between
x = 150 and x = 300y
Assume that the points lie on the grid lines.
y = ft/day
 |
Expert Answer:

Related Book For 

Posted Date:
