

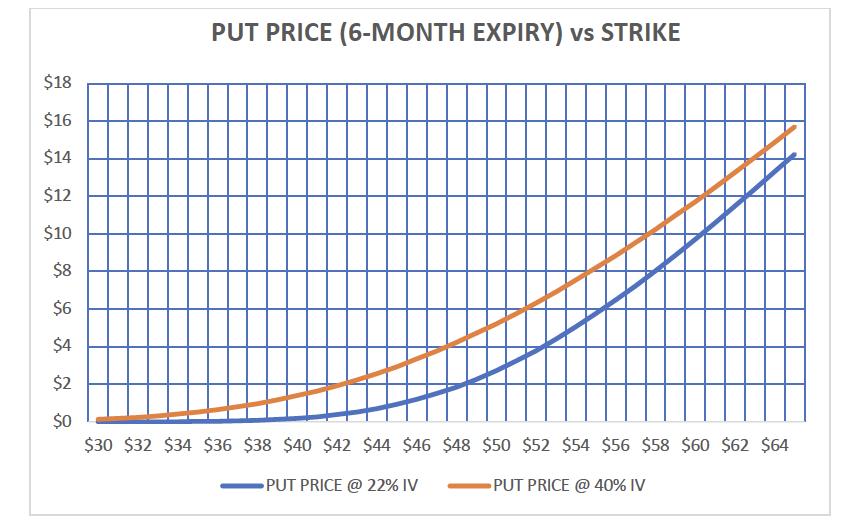
The graph shows the price profile (option price vs. strike, in the Black-Scholes model) of 6- month
Fantastic news! We've Found the answer you've been seeking!
Question:
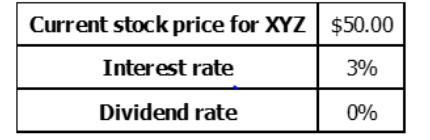
The graph shows the price profile (option price vs. strike, in the Black-Scholes model) of 6- month options on XYZ, for two different implied volatilities (IVs): 22% and 40%. Recall that 22% was the implied volatility where the $50-strike put was priced, and 40% was the implied volatility where the $30-strike put was priced.
At what value of the strike is the price difference (for the two different implied volatilities)
the biggest? Any thoughts on this?
Expert Answer:
Based on the information provided the price difference between options priced with 22 and 40 implied ... View the full answer

Related Book For 
Corporate Finance
ISBN: 978-0077861759
10th edition
Authors: Stephen Ross, Randolph Westerfield, Jeffrey Jaffe
Posted Date:
