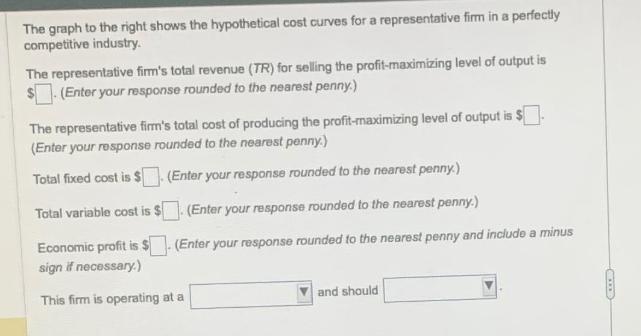
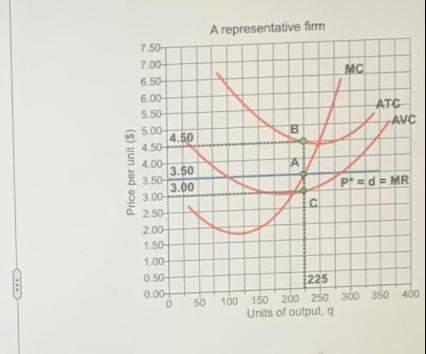
The graph to the right shows the hypothetical cost curves for a representative firm in a...
Fantastic news! We've Found the answer you've been seeking!
Question:
Transcribed Image Text:
The graph to the right shows the hypothetical cost curves for a representative firm in a perfectly competitive industry. The representative firm's total revenue (TR) for selling the profit-maximizing level of output is $(Enter your response rounded to the nearest penny.) The representative firm's total cost of producing the profit-maximizing level of output is $ (Enter your response rounded to the nearest penny.) Total fixed cost is $. (Enter your response rounded to the nearest penny.) Total variable cost is $. (Enter your response rounded to the nearest penny.) Economic profit is $ sign if necessary.) This firm is operating at a (Enter your response rounded to the nearest penny and include a minus and should Price per unit ($) 7.50 7.00- 6.50- 6.00- 5.50- 5.00- 4.50- 4.00- 3.50- 3.00- 2.50- 4.50 3.50 3.00 2.00- 1.50 1.00- 0.50- 0.00+ 0 A representative firm B A C MC ATC AVC Pr=d = MR $225 50 100 150 200 250 300 350 400 Units of output, q The graph to the right shows the hypothetical cost curves for a representative firm in a perfectly competitive industry. The representative firm's total revenue (TR) for selling the profit-maximizing level of output is $(Enter your response rounded to the nearest penny.) The representative firm's total cost of producing the profit-maximizing level of output is $ (Enter your response rounded to the nearest penny.) Total fixed cost is $. (Enter your response rounded to the nearest penny.) Total variable cost is $. (Enter your response rounded to the nearest penny.) Economic profit is $ sign if necessary.) This firm is operating at a (Enter your response rounded to the nearest penny and include a minus and should Price per unit ($) 7.50 7.00- 6.50- 6.00- 5.50- 5.00- 4.50- 4.00- 3.50- 3.00- 2.50- 4.50 3.50 3.00 2.00- 1.50 1.00- 0.50- 0.00+ 0 A representative firm B A C MC ATC AVC Pr=d = MR $225 50 100 150 200 250 300 350 400 Units of output, q
Expert Answer:
Answer rating: 100% (QA)
Analyzing the Perfectly Competitive Firms Costs and Profits Based on the graph we can analyze the perfectly competitive firms costs and profits Total ... View the full answer
Related Book For
Microeconomics
ISBN: 9781464146978
1st Edition
Authors: Austan Goolsbee, Steven Levitt, Chad Syverson
Posted Date:
Students also viewed these economics questions
-
The graph below depicts the market for aloe vera gel. The left-hand panel depicts market demand and industry supply; the right-hand panel depicts the long-run cost curves for a representative firm in...
-
Based on the IHRM analysis, the following recommendations are made to improve the effectiveness of Pfizer's performance management practices in the global context ( explain 1-5 in detail ) : 1....
-
A trader has a soft limit of $8MM USD and a hard limit of $10MM USD. Their current NOP is $3MM USD. They purchase $6MM USD, sell $1MM USD, and then purchase another $5MM USD. Which of the following...
-
Amazon.com, Inc.'s 2013 financial statements are presented at www.amazon.com. Financial statements of Wal-Mart Stores, Inc. for 2013 are presented at www.walmart.com. Instructions (a) Based on the...
-
discuss the emerging role of hormone-based therapies, such as hormone replacement therapy (HRT) and hormone-targeted cancer treatments, in managing hormone-related disorders and optimizing patient...
-
What are the main functions of good environmental management? Which environmental management tools are related to each of these functions? Are there any environmental management tools common to all...
-
Eagleton Manufacturing is developing an activity-based costing system to improve overhead cost allocation. One of the first steps in developing the system is to classify the costs of performing...
-
What are the comments and reaction about per given topic discussed: 1. Central Banks and Federal Reserve Banks in the World and their development 2. Brief History of the Bangko Sentral ng Pilipinas...
-
If the Sommers had chosen the original 15-year, 6.25% mortgage proposal, how much tax shelter would they have lost (over the last five years) as compared to the 30-year, 7.25% mortgage?
-
Three project teams are working on parts of a single project. The parts are highly dependent on each other. The leader of the team indicates that this might create conflicts when the outputs from the...
-
Jennifer has $100,000 in personal taxable income. Her filing status is married filing jointly. Based on the marginal tax rates from Module 1 handout, how much tax does Jennifer owe to the government?
-
Delta Corporation manufactures two products, Flow and Glow. They use a standard cost system based on direct labor hours. Assume that the quantity of units purchased for materials is equal to the...
-
Milo Manufacturing produces products Kappa and Lambda from a joint process. Total joint costs are $160,000. The sales value at split- off was $169,200 for 5,200 units of Kappa and $63,280 for 7,800...
-
Locate a *scholarly article regarding Police Liability (or a closely related topic on police officers / policing) . A *scholarly article will come from a published Journal, and it contains original...
-
Evaluate the line integral on the corresponding trajectory. If possible, apply the Cauchy- Goursat theorem or some of its consequences z-5z+i dz; C:|z|= 3 z-1+2i C counter clockwise
-
Controlled Move Show times in TMUs and seconds. (1) An associate grasps an oven door within reach and pulls itopen 18 inches with the left hand (he does not relinquish controlof the door). With a pan...
-
Refer to the Conservation Ecology (Dec. 2003) study of the causes of forest fragmentation, presented in Exercise 2.166 (p. 97). Recall that the researchers used advanced high-resolution satellite...
-
For the following production functions, Write an equation and graph the isoquant for Q = 100. Find the marginal rate of technical substitution and discuss how MRTSLK changes as the firm uses more...
-
Consider the production function presented in the table below: a. If the firm decides to employ 6 units of capital and 1 worker, what is its output? b. What other combinations of capital and labor...
-
Consider a monopolistically competitive industry. A graph of demand and cost conditions for a typical firm is depicted in the diagram below. a. Is this firm generating producer surplus? Is this firm...
-
The upper curve in the boiling point diagram is called (a) The saturated vapour curve (b) The dew point curve (c) The saturated liquid curve (d) Both (a) and (b).
-
A vertical cylinder containing helium gas is filled with a piston of \(50 \mathrm{~kg}\) mass and crosssectional area of \(0.025 \mathrm{~m}^{2}\). If the atmospheric pressure outside the cylinder is...
-
The Joule-Thomson coefficient for any gas at inversion point is (a) 1 (b) 0 (c) 2 (d) 3
Study smarter with the SolutionInn App