

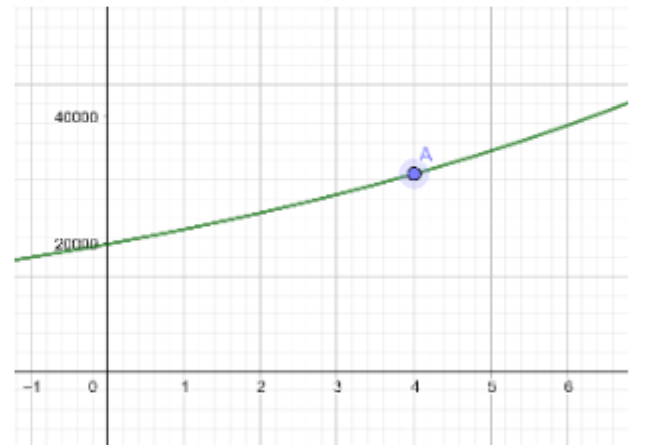
the graphic represents the deer population between 2012 and 2018 : the equation is: And the population
Fantastic news! We've Found the answer you've been seeking!
Question:
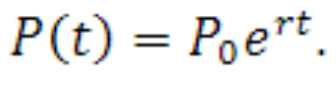
the graphic represents the deer population between 2012 and 2018 : the equation is:
And the population in 2016 was 31000
in what year the deer population will reach 60000?
Expert Answer:

Related Book For 

Understanding Basic Statistics
ISBN: 9781111827021
6th Edition
Authors: Charles Henry Brase, Corrinne Pellillo Brase
Posted Date:
