

The graphs below labeled (a) and (b) show the titration curves for two equal-volume samples of monoprotic
Fantastic news! We've Found the answer you've been seeking!
Question:
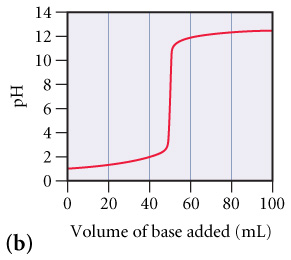
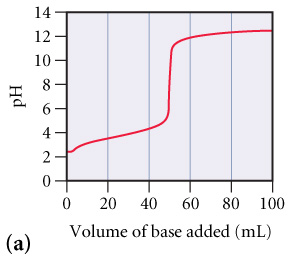
The graphs below labeled (a) and (b) show the titration curves for two equal-volume samples of monoprotic acids, one weak and one strong. Both titrations were carried out with the same concentration of strong base.
What is the approximate pH at the equivalence point of (a) curve? (Figure 1)
Express your answer as a whole numbe
c
Part B
What is the approximate pH at the equivalence point of (b) curve?(Figure 2)
Express your answer as a whole number.
Part C
Which curve corresponds to the titration of the strong acid and which one to the titration of the weak acid?
| Graph (a) represents a weak acid and graph (b) represents a strong acid. | |
| Graph (b) represents a weak acid and graph (a) represents a strong acid. |
Expert Answer:

Related Book For 

Chemistry The Central Science
ISBN: 978-0321696724
12th edition
Authors: Theodore Brown, Eugene LeMay, Bruce Bursten, Catherine Murphy, Patrick Woodward
Posted Date:
