

The Henley Corporation is a privately held company specializing in lawn care products and services. The...
Fantastic news! We've Found the answer you've been seeking!
Question:
Transcribed Image Text:
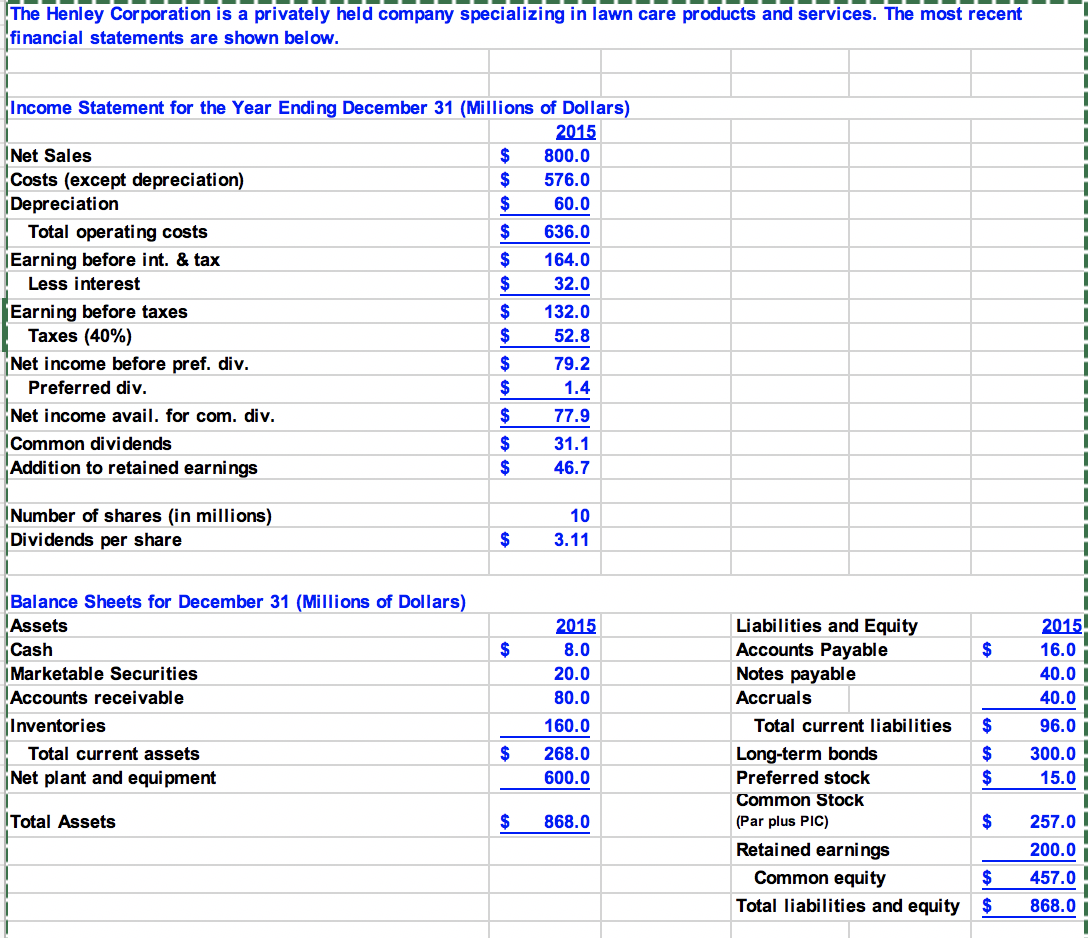
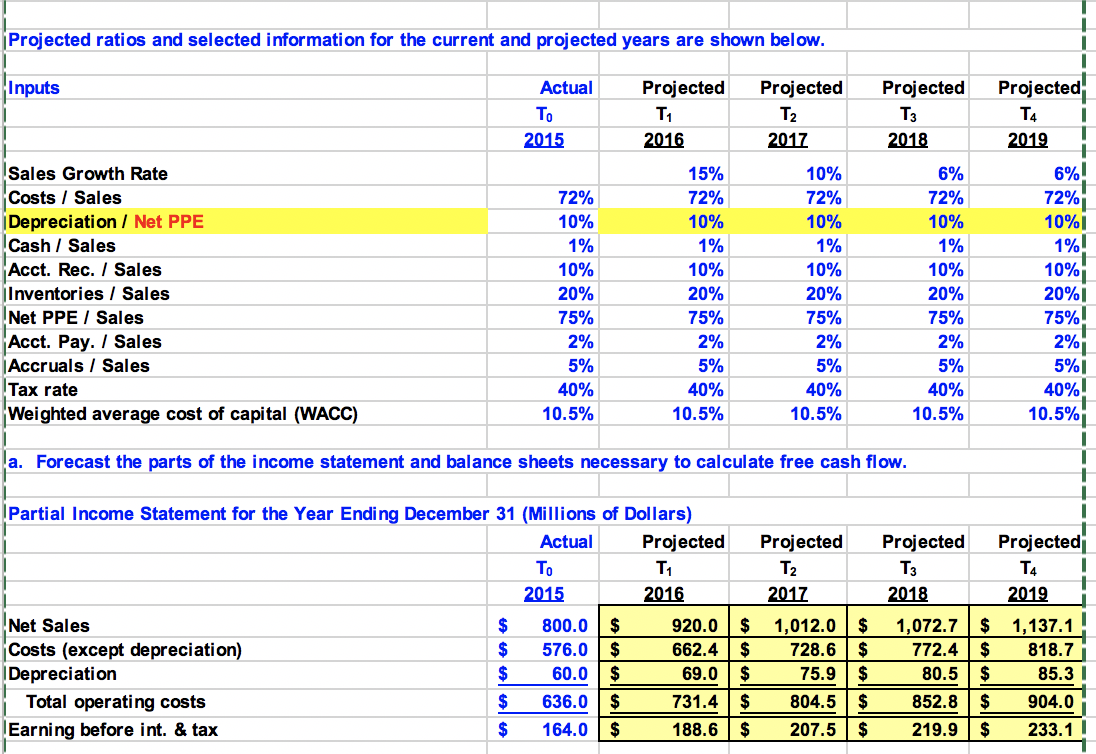
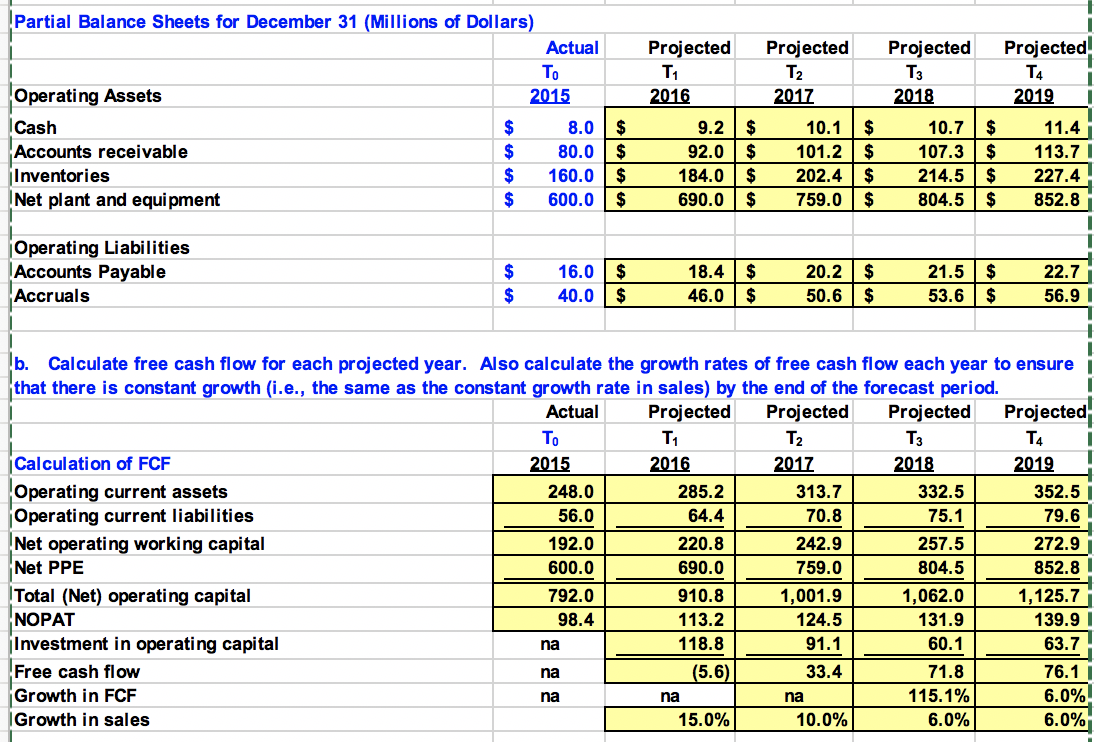
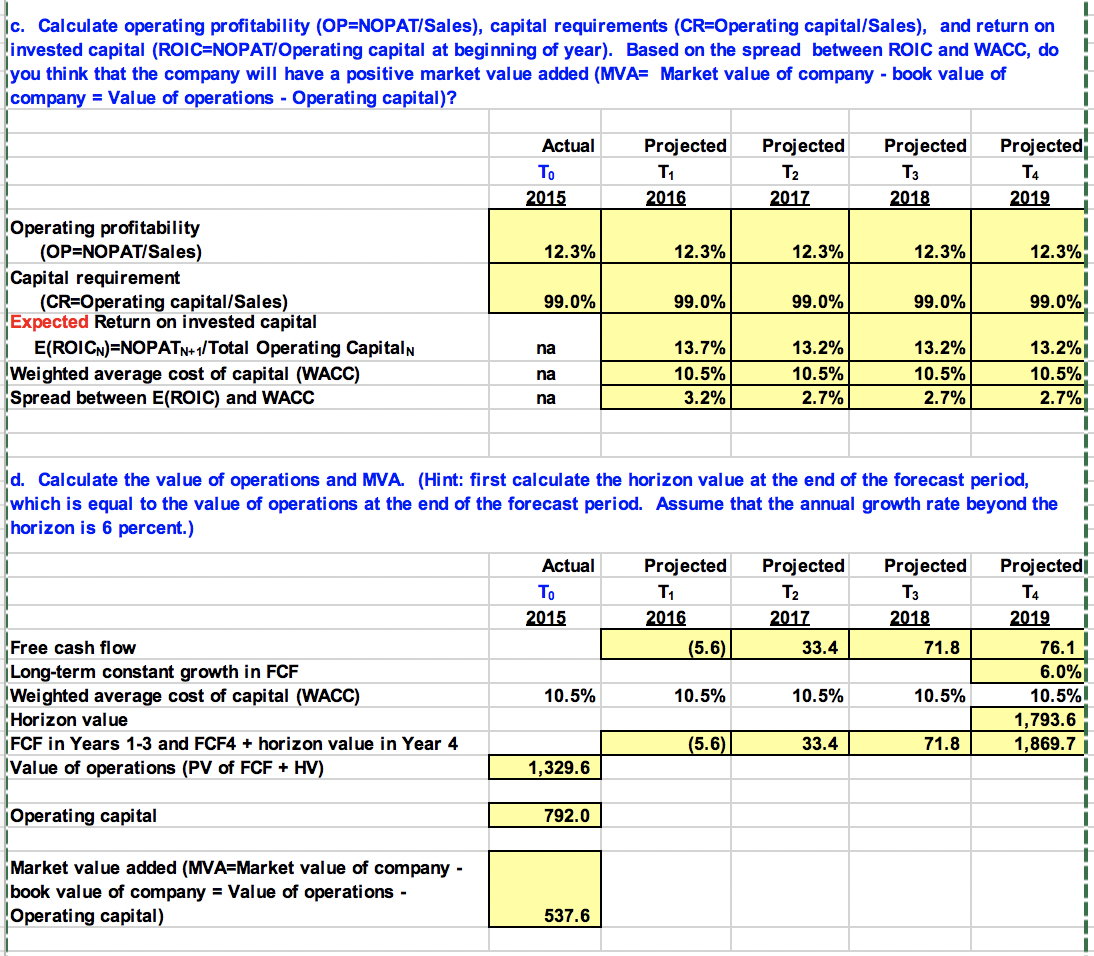
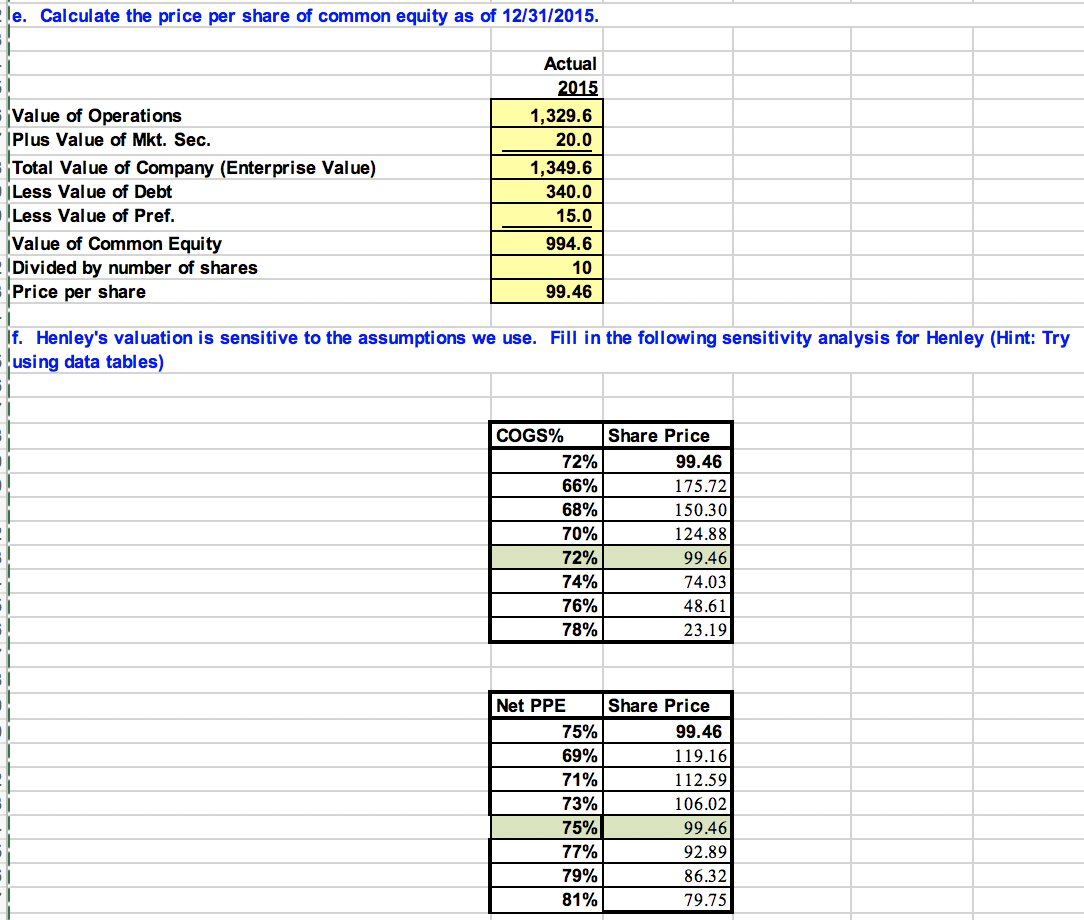
The Henley Corporation is a privately held company specializing in lawn care products and services. The most recent financial statements are shown below. Income Statement for the Year Ending December 31 (Millions of Dollars) 2015 Net Sales $ 800.0 Costs (except depreciation) $ 576.0 Depreciation $ 60.0 Total operating costs $ 636.0 Earning before int. & tax $ 164.0 Less interest $ 32.0 Earning before taxes $ 132.0 Taxes (40%) $ 52.8 Net income before pref. div. $ 79.2 Preferred div. $ 1.4 Net income avail. for com. div. $ 77.9 Common dividends $ 31.1 Addition to retained earnings $ 46.7 Number of shares (in millions) Dividends per share 10 $ 3.11 Balance Sheets for December 31 (Millions of Dollars) Assets 2015 Liabilities and Equity 2015 Cash $ 8.0 Accounts Payable $ 16.0 Marketable Securities 20.0 Notes payable 40.0 Accounts receivable 80.0 Accruals 40.0 Inventories 160.0 Total current liabilities $ 96.0 Total current assets $ 268.0 Long-term bonds $ 300.0 Net plant and equipment 600.0 Preferred stock $ 15.0 Common Stock Total Assets $ 868.0 (Par plus PIC) $ 257.0 Retained earnings 200.0 Common equity $ 457.0 Total liabilities and equity $ 868.0 Projected ratios and selected information for the current and projected years are shown below. Inputs Sales Growth Rate Costs / Sales Depreciation / Net PPE Cash / Sales Acct. Rec. / Sales Inventories / Sales Net PPE / Sales Acct. Pay. Sales Accruals Sales Tax rate Weighted average cost of capital (WACC) Actual Projected T Projected T2 Projected Projected T3 T4 2015 2016 2017 2018 2019 + 15% 10% 6% 6%! 72% 72% 72% 72% 72% 10% 10% 10% 10% 10% 1% 1% 1% 1% 1%! 10% 10% 10% 10% 10% 20% 20% 20% 20% 20% 75% 75% 75% 75% 75%! 2% 2% 2% 2% 2% 5% 5% 5% 5% 5% 40% 10.5% 40% 40% 40% 40%! 10.5% 10.5% 10.5% 10.5% a. Forecast the parts of the income statement and balance sheets necessary to calculate free cash flow. Partial Income Statement for the Year Ending December 31 (Millions of Dollars) Actual 2015 Projected 2016 Projected T2 Projected T3 Projected T4 + 2017 2018 2019 Net Sales $ 800.0 $ 920.0 $ 1,012.0 $ 1,072.7 $ 1,137.1 Costs (except depreciation) $ 576.0 $ 662.4 $ 728.6 $ 772.4 $ 818.7 Depreciation $ 60.0 $ 69.0 $ 75.9 $ 80.5 $ 85.3 Total operating costs $ 636.0 $ 731.4 $ 804.5 $ 852.8 $ 904.0 Earning before int. & tax $ 164.0 $ 188.6 $ 207.5 $ 219.9 $ 233.1 Partial Balance Sheets for December 31 (Millions of Dollars) Actual Projected Operating Assets 2015 2016 Projected T 2017 Projected T3 2018 Projected T4 2019 Cash $ 8.0 $ 9.2 $ 10.1 $ 10.7 $ 11.4 Accounts receivable $ 80.0 $ 92.0 $ 101.2 $ 107.3 $ 113.7 Inventories $ 160.0 $ 184.0 $ 202.4 $ 214.5 $ 227.4 Net plant and equipment $ 600.0 $ 690.0 $ 759.0 $ 804.5 $ 852.8 Operating Liabilities Accounts Payable Accruals $ 16.0 $ $ 40.0 $ 18.4 46.0 $ $ 20.2 $ 50.6 $ 21.5 $ 22.7 53.6 $ 56.9 b. Calculate free cash flow for each projected year. Also calculate the growth rates of free cash flow each year to ensure that there is constant growth (i.e., the same as the constant growth rate in sales) by the end of the forecast period. Actual Projected Projected Projected Projected T T2 T3 T4 Calculation of FCF Operating current assets 2015 2016 2017 2018 2019 248.0 285.2 313.7 332.5 352.5 Operating current liabilities 56.0 64.4 70.8 75.1 79.6 Net operating working capital Net PPE 192.0 220.8 242.9 257.5 272.9 600.0 690.0 759.0 804.5 852.8 NOPAT Total (Net) operating capital Investment in operating capital 792.0 910.8 1,001.9 1,062.0 1,125.7 98.4 113.2 124.5 131.9 139.9 na 118.8 91.1 60.1 63.7 Free cash flow Growth in FCF na (5.6) 33.4 71.8 76.1 na na na 115.1% 6.0% Growth in sales 15.0% 10.0% 6.0% 6.0% c. Calculate operating profitability (OP=NOPAT/Sales), capital requirements (CR=Operating capital/Sales), and return on invested capital (ROIC=NOPAT/Operating capital at beginning of year). Based on the spread between ROIC and WACC, do you think that the company will have a positive market value added (MVA= Market value of company - book value of company = Value of operations - Operating capital)? Actual Projected 1 Projected T2 Projected Projected T3 T 2015 2016 2017 2018 2019 Operating profitability (OP=NOPAT/Sales) Capital requirement (CR=Operating capital/Sales) 12.3% 12.3% 12.3% 12.3% 12.3% 99.0% 99.0% 99.0% 99.0% 99.0% Expected Return on invested capital E(ROICN)=NOPAT N+1/Total Operating Capital N na 13.7% 13.2% 13.2% 13.2% Weighted average cost of capital (WACC) na 10.5% 10.5% 10.5% 10.5% Spread between E(ROIC) and WACC na 3.2% 2.7% 2.7% 2.7% d. Calculate the value of operations and MVA. (Hint: first calculate the horizon value at the end of the forecast period, which is equal to the value of operations at the end of the forecast period. Assume that the annual growth rate beyond the jhorizon is 6 percent.) 1 Actual Projected Projected T2 Projected T3 Projected T4 2015 2016 2017 2018 2019 Free cash flow (5.6) 33.4 71.8 76.1 Long-term constant growth in FCF 6.0% Weighted average cost of capital (WACC) 10.5% 10.5% 10.5% 10.5% 10.5% Horizon value 1,793.6 FCF in Years 1-3 and FCF4 + horizon value in Year 4 Value of operations (PV of FCF + HV) (5.6) 33.4 71.8 1,869.7 1,329.6 L Operating capital 792.0 Market value added (MVA-Market value of company - book value of company = Value of operations - Operating capital) 537.6 le. Calculate the price per share of common equity as of 12/31/2015. Actual 2015 Value of Operations 1,329.6 Plus Value of Mkt. Sec. 20.0 Total Value of Company (Enterprise Value) 1,349.6 Less Value of Debt 340.0 Less Value of Pref. 15.0 Value of Common Equity 994.6 Divided by number of shares Price per share 10 99.46 If. Henley's valuation is sensitive to the assumptions we use. Fill in the following sensitivity analysis for Henley (Hint: Try using data tables) COGS% Share Price 72% 99.46 66% 175.72 68% 150.30 70% 124.88 72% 99.46 74% 74.03 76% 48.61 78% 23.19 Net PPE Share Price 75% 99.46 69% 119.16 71% 112.59 73% 106.02 75% 99.46 77% 92.89 79% 86.32 81% 79.75 g. You are the CFO of Hampton Corporation, a large producer of Lawn products. Recently your CEO has been in communication with the CEO of Henley Corporation a smaller producer of Lawn product about a possible merger. Your CEO (Scott Hampton) has asked you to analyze the merger opportunity and make a recommendation. According to Mr. Hampton, the CEO of Henley is asking $110 a share for the equity in his firm. Do you recommend the Merger? Why or why not? The Henley Corporation is a privately held company specializing in lawn care products and services. The most recent financial statements are shown below. Income Statement for the Year Ending December 31 (Millions of Dollars) 2015 Net Sales $ 800.0 Costs (except depreciation) $ 576.0 Depreciation $ 60.0 Total operating costs $ 636.0 Earning before int. & tax $ 164.0 Less interest $ 32.0 Earning before taxes $ 132.0 Taxes (40%) $ 52.8 Net income before pref. div. $ 79.2 Preferred div. $ 1.4 Net income avail. for com. div. $ 77.9 Common dividends $ 31.1 Addition to retained earnings $ 46.7 Number of shares (in millions) Dividends per share 10 $ 3.11 Balance Sheets for December 31 (Millions of Dollars) Assets 2015 Liabilities and Equity 2015 Cash $ 8.0 Accounts Payable $ 16.0 Marketable Securities 20.0 Notes payable 40.0 Accounts receivable 80.0 Accruals 40.0 Inventories 160.0 Total current liabilities $ 96.0 Total current assets $ 268.0 Long-term bonds $ 300.0 Net plant and equipment 600.0 Preferred stock $ 15.0 Common Stock Total Assets $ 868.0 (Par plus PIC) $ 257.0 Retained earnings 200.0 Common equity $ 457.0 Total liabilities and equity $ 868.0 Projected ratios and selected information for the current and projected years are shown below. Inputs Sales Growth Rate Costs / Sales Depreciation / Net PPE Cash / Sales Acct. Rec. / Sales Inventories / Sales Net PPE / Sales Acct. Pay. Sales Accruals Sales Tax rate Weighted average cost of capital (WACC) Actual Projected T Projected T2 Projected Projected T3 T4 2015 2016 2017 2018 2019 + 15% 10% 6% 6%! 72% 72% 72% 72% 72% 10% 10% 10% 10% 10% 1% 1% 1% 1% 1%! 10% 10% 10% 10% 10% 20% 20% 20% 20% 20% 75% 75% 75% 75% 75%! 2% 2% 2% 2% 2% 5% 5% 5% 5% 5% 40% 10.5% 40% 40% 40% 40%! 10.5% 10.5% 10.5% 10.5% a. Forecast the parts of the income statement and balance sheets necessary to calculate free cash flow. Partial Income Statement for the Year Ending December 31 (Millions of Dollars) Actual 2015 Projected 2016 Projected T2 Projected T3 Projected T4 + 2017 2018 2019 Net Sales $ 800.0 $ 920.0 $ 1,012.0 $ 1,072.7 $ 1,137.1 Costs (except depreciation) $ 576.0 $ 662.4 $ 728.6 $ 772.4 $ 818.7 Depreciation $ 60.0 $ 69.0 $ 75.9 $ 80.5 $ 85.3 Total operating costs $ 636.0 $ 731.4 $ 804.5 $ 852.8 $ 904.0 Earning before int. & tax $ 164.0 $ 188.6 $ 207.5 $ 219.9 $ 233.1 Partial Balance Sheets for December 31 (Millions of Dollars) Actual Projected Operating Assets 2015 2016 Projected T 2017 Projected T3 2018 Projected T4 2019 Cash $ 8.0 $ 9.2 $ 10.1 $ 10.7 $ 11.4 Accounts receivable $ 80.0 $ 92.0 $ 101.2 $ 107.3 $ 113.7 Inventories $ 160.0 $ 184.0 $ 202.4 $ 214.5 $ 227.4 Net plant and equipment $ 600.0 $ 690.0 $ 759.0 $ 804.5 $ 852.8 Operating Liabilities Accounts Payable Accruals $ 16.0 $ $ 40.0 $ 18.4 46.0 $ $ 20.2 $ 50.6 $ 21.5 $ 22.7 53.6 $ 56.9 b. Calculate free cash flow for each projected year. Also calculate the growth rates of free cash flow each year to ensure that there is constant growth (i.e., the same as the constant growth rate in sales) by the end of the forecast period. Actual Projected Projected Projected Projected T T2 T3 T4 Calculation of FCF Operating current assets 2015 2016 2017 2018 2019 248.0 285.2 313.7 332.5 352.5 Operating current liabilities 56.0 64.4 70.8 75.1 79.6 Net operating working capital Net PPE 192.0 220.8 242.9 257.5 272.9 600.0 690.0 759.0 804.5 852.8 NOPAT Total (Net) operating capital Investment in operating capital 792.0 910.8 1,001.9 1,062.0 1,125.7 98.4 113.2 124.5 131.9 139.9 na 118.8 91.1 60.1 63.7 Free cash flow Growth in FCF na (5.6) 33.4 71.8 76.1 na na na 115.1% 6.0% Growth in sales 15.0% 10.0% 6.0% 6.0% c. Calculate operating profitability (OP=NOPAT/Sales), capital requirements (CR=Operating capital/Sales), and return on invested capital (ROIC=NOPAT/Operating capital at beginning of year). Based on the spread between ROIC and WACC, do you think that the company will have a positive market value added (MVA= Market value of company - book value of company = Value of operations - Operating capital)? Actual Projected 1 Projected T2 Projected Projected T3 T 2015 2016 2017 2018 2019 Operating profitability (OP=NOPAT/Sales) Capital requirement (CR=Operating capital/Sales) 12.3% 12.3% 12.3% 12.3% 12.3% 99.0% 99.0% 99.0% 99.0% 99.0% Expected Return on invested capital E(ROICN)=NOPAT N+1/Total Operating Capital N na 13.7% 13.2% 13.2% 13.2% Weighted average cost of capital (WACC) na 10.5% 10.5% 10.5% 10.5% Spread between E(ROIC) and WACC na 3.2% 2.7% 2.7% 2.7% d. Calculate the value of operations and MVA. (Hint: first calculate the horizon value at the end of the forecast period, which is equal to the value of operations at the end of the forecast period. Assume that the annual growth rate beyond the jhorizon is 6 percent.) 1 Actual Projected Projected T2 Projected T3 Projected T4 2015 2016 2017 2018 2019 Free cash flow (5.6) 33.4 71.8 76.1 Long-term constant growth in FCF 6.0% Weighted average cost of capital (WACC) 10.5% 10.5% 10.5% 10.5% 10.5% Horizon value 1,793.6 FCF in Years 1-3 and FCF4 + horizon value in Year 4 Value of operations (PV of FCF + HV) (5.6) 33.4 71.8 1,869.7 1,329.6 L Operating capital 792.0 Market value added (MVA-Market value of company - book value of company = Value of operations - Operating capital) 537.6 le. Calculate the price per share of common equity as of 12/31/2015. Actual 2015 Value of Operations 1,329.6 Plus Value of Mkt. Sec. 20.0 Total Value of Company (Enterprise Value) 1,349.6 Less Value of Debt 340.0 Less Value of Pref. 15.0 Value of Common Equity 994.6 Divided by number of shares Price per share 10 99.46 If. Henley's valuation is sensitive to the assumptions we use. Fill in the following sensitivity analysis for Henley (Hint: Try using data tables) COGS% Share Price 72% 99.46 66% 175.72 68% 150.30 70% 124.88 72% 99.46 74% 74.03 76% 48.61 78% 23.19 Net PPE Share Price 75% 99.46 69% 119.16 71% 112.59 73% 106.02 75% 99.46 77% 92.89 79% 86.32 81% 79.75 g. You are the CFO of Hampton Corporation, a large producer of Lawn products. Recently your CEO has been in communication with the CEO of Henley Corporation a smaller producer of Lawn product about a possible merger. Your CEO (Scott Hampton) has asked you to analyze the merger opportunity and make a recommendation. According to Mr. Hampton, the CEO of Henley is asking $110 a share for the equity in his firm. Do you recommend the Merger? Why or why not?
Expert Answer:

Related Book For 

Financial management theory and practice
ISBN: 978-1439078099
13th edition
Authors: Eugene F. Brigham and Michael C. Ehrhardt
Posted Date:
Students also viewed these finance questions
-
Start with the partial model in the file Ch13 P11 Build a Model.xls on the textbooks Web site. The Henley Corporation is a privately held company specializing in lawn care products and services. The...
-
Henley Corporation is a privately held company specializing in lawn care products and services. The most recent financial statements are shown below. The ratios and selected information for the...
-
A deposit of $4000 is made into an account that earns 11% annual simple interest. How much additional money must be deposited into an account that pays 14% annual simple interest so that the total...
-
List and define the five elements of an inferential statistical analysis.
-
Would a change in the price of ice cream likely cause a change in the demand for frozen yogurt, a substitute?
-
Consider forecasting with the \(A R(1)\) model. a. Use the forecasting chain rule in equation (8.4) to show \[y_{T+k}-\widehat{y}_{T+k} \approx \varepsilon_{T+k}+\beta_{1}...
-
Compute the overhead rate per service request for the Maintenance Department if estimated overhead costs are $18,290 and the number of estimated service request is 3,100.
-
Prepare a condensed cost of goods manufactured schedule The following information is available for Sheridan Company at December 31, 2022: 1. Inventory balance Beginning of Year End of Year Finished...
-
If the bond provides 11% nominal return to the investor in a year with 4% inflation, the investor's real return is 6.73%. Could you be kind and show in detail which formula was applied and how it was...
-
List five (5) considerations for a library when handling cash, include information on clients, staff, the risk of theft, and security ?
-
According to the Gartner Analytic Ascendancy Model, "What social media tactics are needed to drive 150 percent more clicks?" is what type of question? Explain.
-
The following questions are included on the internal control questionnaire for Ingrid Company related to cash. 1. Do different people handle cash and maintain the records of cash receipts? 2. Is a...
-
How can computer simulations be used in business to handle risky cash flow estimates?
-
Critically examine current attitudes and understandings of mental health in Australia and explain how do the counselors and psychotherapists contribute to the wellbeing of people with mental health...
-
What is strategy? Watch the video of Michael porter and prepare a brief summary report and includes your reaction to and observations about this video.
-
A circular concrete shaft liner with Youngs modulus of 3.4 million psi, Poissons ratio of 0.25, unconfined compressive strength 3,500 psi and tensile strength 350 psi is loaded to the verge of...
-
Which of Yellows statements regarding the factors affecting the selection of a trading strategy is correct? A. Statement 1 B. Statement 2 C. Statement 3 Robert Harding is a portfolio manager at...
-
To fill the remaining portion of the ABC order, Yellow is using: A. an arrival price trading strategy. B. a TWAP participation strategy. C. a VWAP participation strategy. Robert Harding is a...
-
Given the parameters for the benchmark given by Harding, Yellow should recommend a benchmark that is based on the: A. arrival price. B. time-weighted average price. C. volume-weighted average price....

Study smarter with the SolutionInn App