The Lottery data Excel file provides data on the topic of playing the lottery. It is often
Question:
The Lottery data Excel file provides data on the topic of “playing the lottery”. It is often claimed that individuals who play the lottery are those who can least afford to do so, making the impact of the lottery “regressive”. In this context, regressive implies that lower income individuals play the lottery more than do higher income individuals. The data for this analysis include 100 randomly chosen men from a major metropolitan area. For each individual, the following information has been recorded:
• The number of times in the preceding month the individual has played a state-sponsored lottery. This is the dependent variable in the accompanying regression analysis.
• The education of the individual, measured by the number of years of schooling completed. Note that 12 years of schooling completed means that the person has graduated from “high school”, and 16 years of schooling completed means that the person has graduated from college.
• Age in years at the person’s most recent birthday.
• The number of children currently living in the person’s household.
• The person’s annual “wage and salary” income in the previous year (reported in thousands of dollars).
Use the Excel to address the questions below.
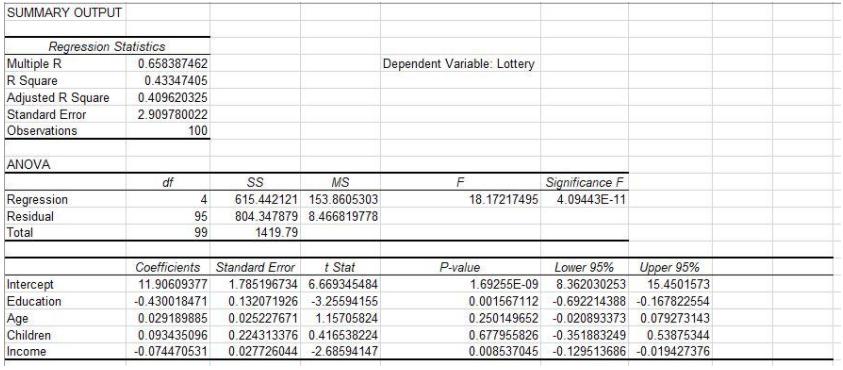
a. For the independent variables “Age” and “Income” interpret the numerical value of the slope in the context of this analysis.
b. Evaluate the statistical significance of each of the four slope estimates. This can be done as a short summary. Start out by indicating the “null value” against which you will be testing each of the four slope estimates. Then, next to the name of each independent variable, state whether the slope is “significant”, and why. The “why” should be stated in no more than a few words or a single sentence.
c. Is the premise of this research, as stated in the opening paragraph of this question (#4) supported by these regression results? Why or why not (a short answer here is preferable).
d. Interpret, in-context, the R-square for this regression.
DATA below:
Expert Answer: