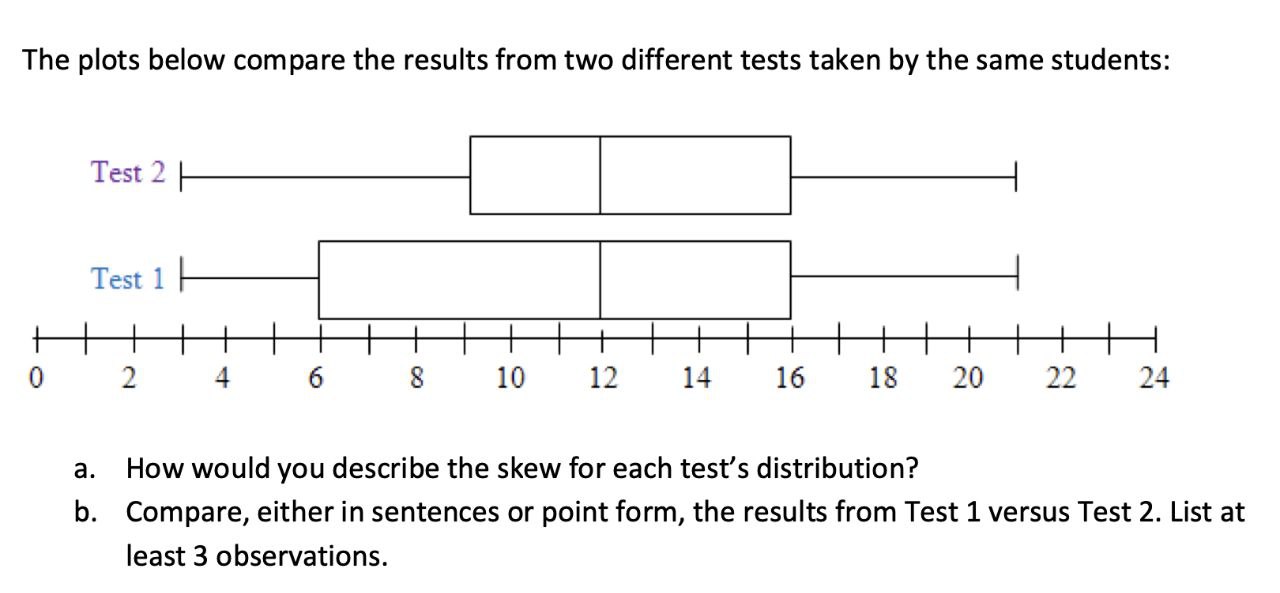
The plots below compare the results from two different tests taken by the same students: 0...
Fantastic news! We've Found the answer you've been seeking!
Question:
Transcribed Image Text:
The plots below compare the results from two different tests taken by the same students: 0 Test 2 H Test 1 6 8 10 12 14 16 18 20 22 24 a. How would you describe the skew for each test's distribution? b. Compare, either in sentences or point form, the results from Test 1 versus Test 2. List at least 3 observations. The plots below compare the results from two different tests taken by the same students: 0 Test 2 H Test 1 6 8 10 12 14 16 18 20 22 24 a. How would you describe the skew for each test's distribution? b. Compare, either in sentences or point form, the results from Test 1 versus Test 2. List at least 3 observations.
Expert Answer:
Posted Date:
Students also viewed these mathematics questions
-
In Exercises sketch the graph of an arbitrary function that satisfies the given condition but does not satisfy the conditions of the Mean Value Theorem on the interval [-5, 5]. is not continuous on...
-
Lynch Corporation has a wholly owned subsidiary in Mexico (Lynmex) with two distinct and unrelated lines of business. Lynmex's Small Appliance Division manufactures small household appliances such as...
-
In 2016, Homer and his wife, Wilma (residents of a non- community property state) make the gifts listed below. Homer's previous taxable gifts consist of $100,000 made in 1975 and $1.4 million made in...
-
Kelly Petroleum Company has a large oil and natural gas project in Oklahoma. The project has been organized into two production centers (petroleum production and natural gas production ) and one...
-
Using computer software, find the least squares regression line for the data in Problem 4-13. Based on the F test, is there a statistically significant relationship between the first test grade and...
-
For questions requiring to use stata please insert the STATA commands that should be used 3. [6.5 points] Refer to the dataset "cyclosporine.xlsx" used in problem 1. This dataset presents data from...
-
University Company produces collegiate apparel. From itsaccounting records, it prepares the following schedule andfinancial statements on a yearly basis. (a) Cost of goods manufactured schedule. (b)...
-
7. Toyota Motor Company, headquartered in Nagoya, Japan was challenged in 2017 according to Reuters. Concerns about the strength of the steel used in its vehicle manufacturing; failing quarterly...
-
Company developed a brand new product called the Mood Marker. The marker will release different colors in response to the user's emotional state. The markers currently cost the company $2.00 each and...
-
what is the Abbot laboratories optimal capital structure and what is the weighted average cost of capital at the optimal structure?
-
A person borrowed $20,000 at the beginning the year 1, every year he is required to pay $4,000 so it is paid off after 10 years. What is the compound annual interest rate? (Hint: use linear...
-
What novel approaches exist for the valorization of biomass-derived feedstocks through catalytic conversion routes, with a focus on the design of efficient catalysts and reaction pathways to produce...
-
Victoria Ltd purchased from Albert Ltd the following parcel of assets and liabilities representing a business. In exchange for these assets and liabilities, Victoria Ltd issued 50 000 shares, and the...
-
Wal-Mart is the second largest retailer in the world. The data file on the disk holds monthly data on Wal-Marts revenue, along with several possibly related economic variables. a) Using computer...
Study smarter with the SolutionInn App