

The purpose of this case is to show our understanding of the Statement of Stockholders' Equity...
Fantastic news! We've Found the answer you've been seeking!
Question:
Transcribed Image Text:
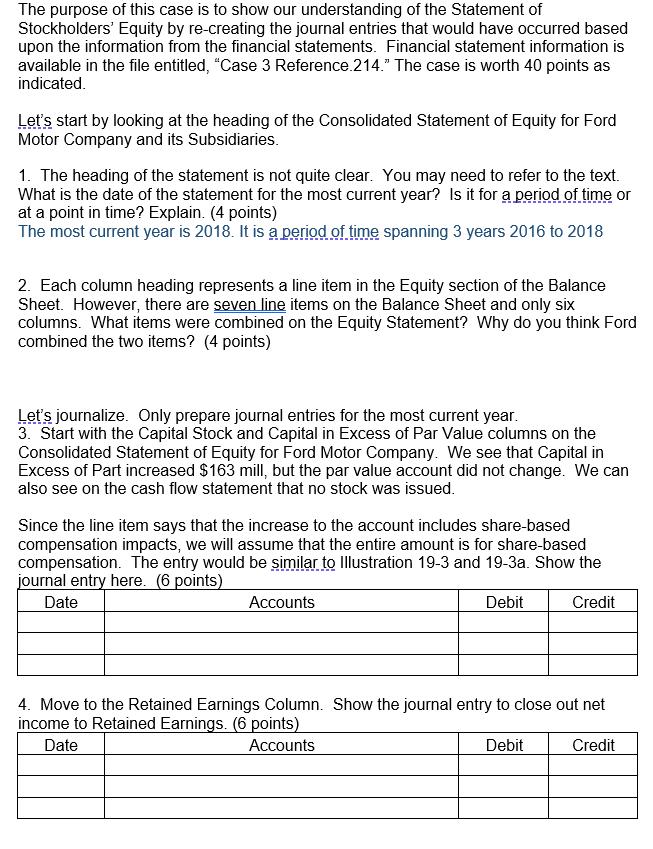
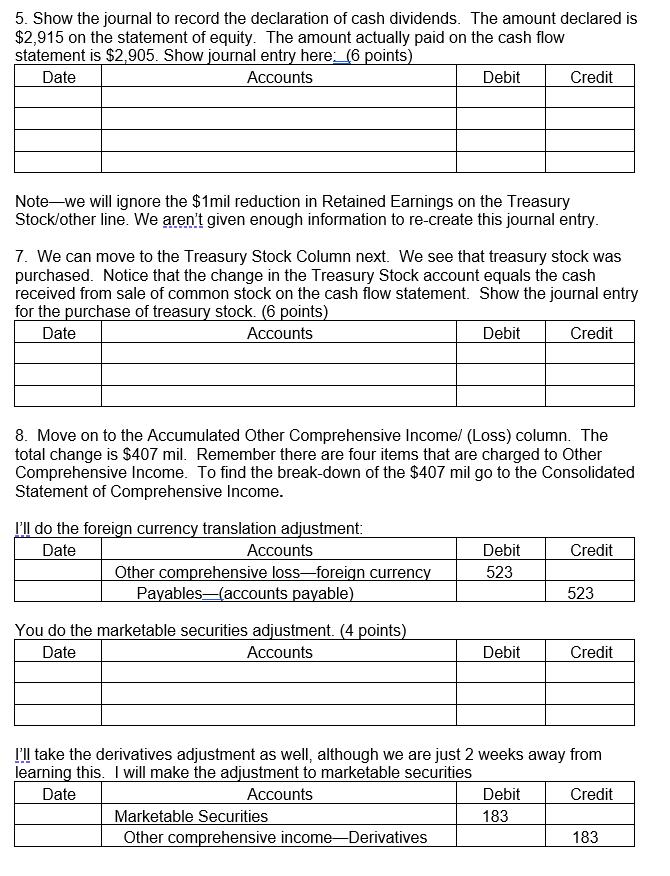
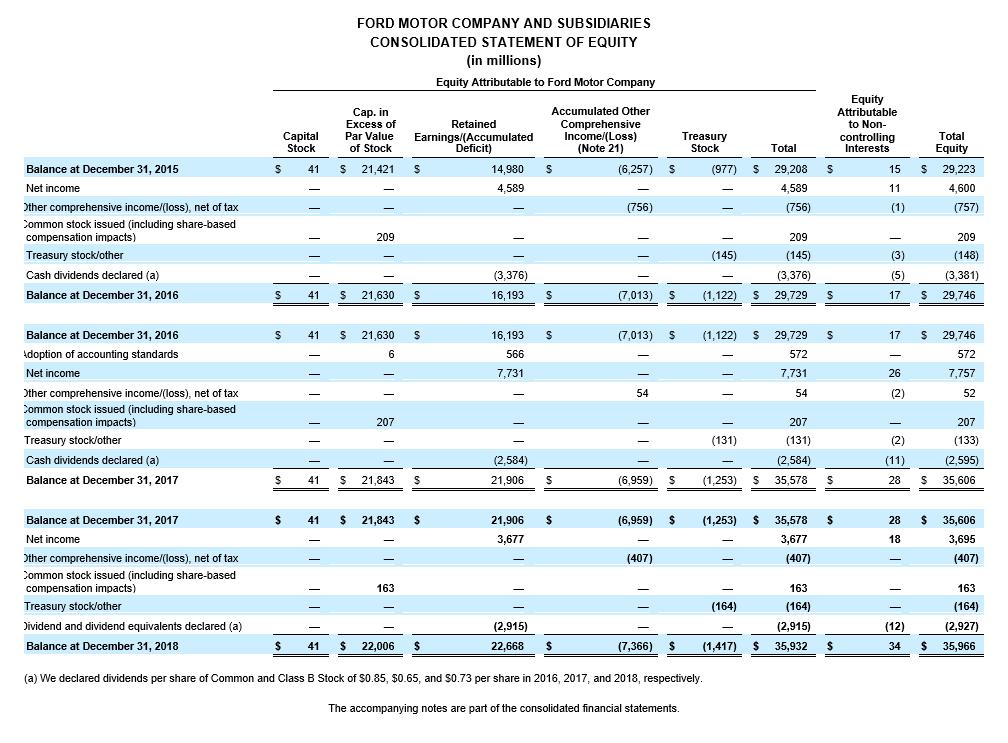
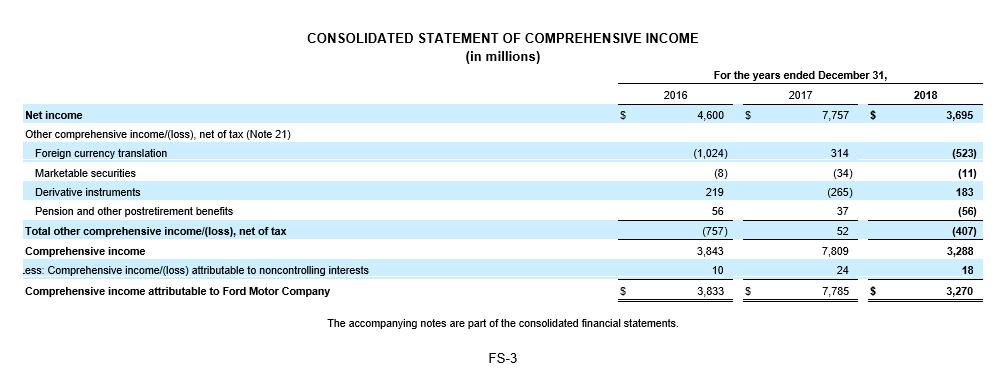
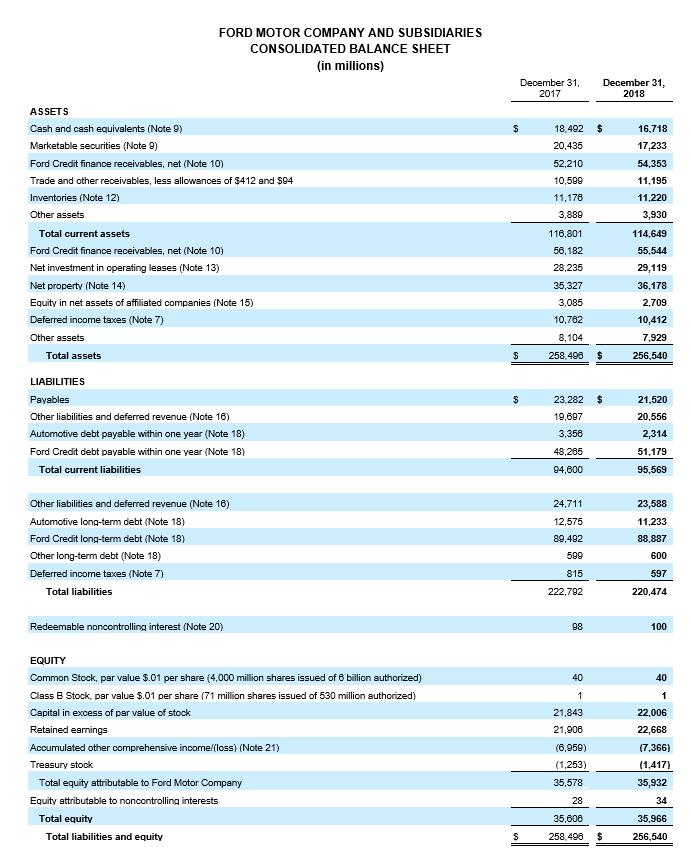
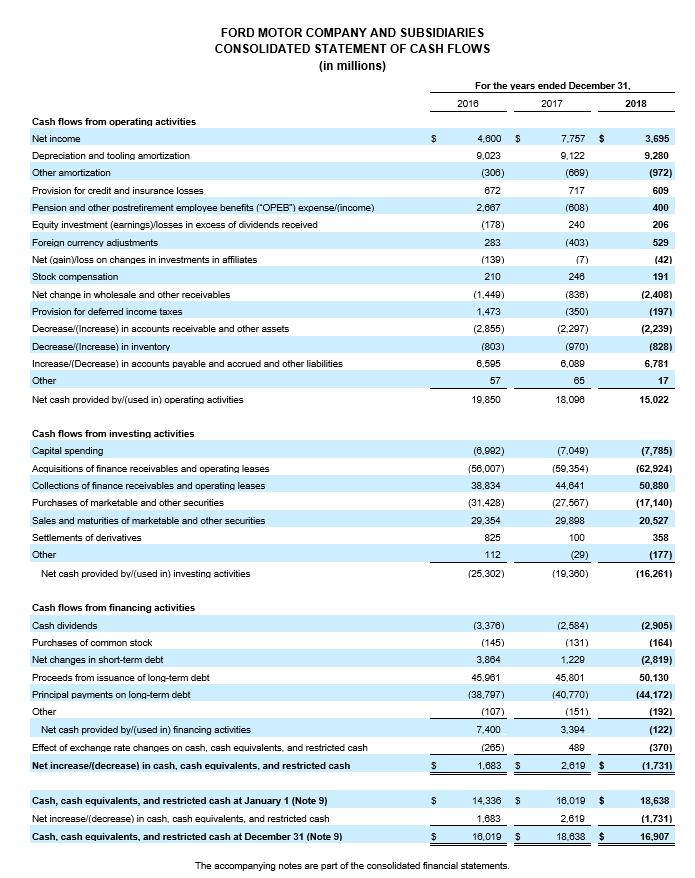
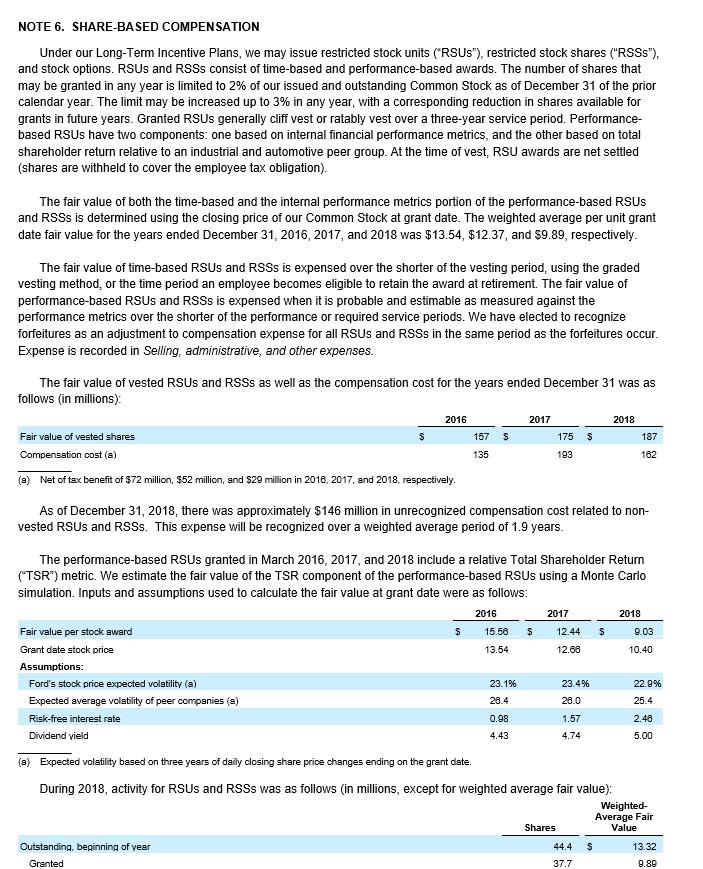
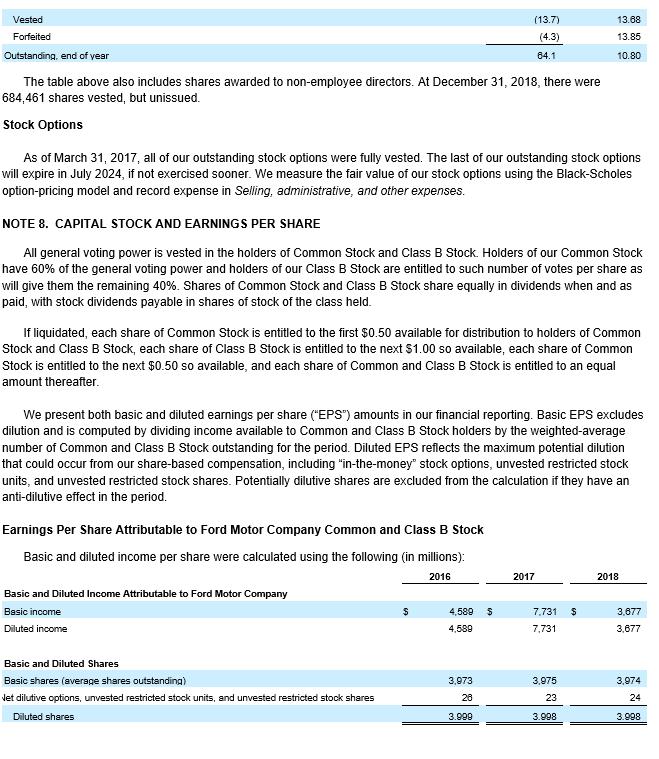
The purpose of this case is to show our understanding of the Statement of Stockholders' Equity by re-creating the journal entries that would have occurred based upon the information from the financial statements. Financial statement information is available in the file entitled, "Case 3 Reference.214." The case is worth 40 points as indicated. Let's start by looking at the heading of the Consolidated Statement of Equity for Ford Motor Company and its Subsidiaries. 1. The heading of the statement is not quite clear. You may need to refer to the text. What is the date of the statement for the most current year? Is it for a period of time or at a point in time? Explain. (4 points) The most current year is 2018. It is a period of time spanning 3 years 2016 to 2018 2. Each column heading represents a line item in the Equity section of the Balance Sheet. However, there are seven line items on the Balance Sheet and only six columns. What items were combined on the Equity Statement? Why do you think Ford combined the two items? (4 points) Let's journalize. Only prepare journal entries for the most current year. 3. Start with the Capital Stock and Capital in Excess of Par Value columns on the Consolidated Statement of Equity for Ford Motor Company. We see that Capital in Excess of Part increased $163 mill, but the par value account did not change. We can also see on the cash flow statement that no stock was issued. Since the line item says that the increase to the account includes share-based compensation impacts, we will assume that the entire amount is for share-based compensation. The entry would be similar to Illustration 19-3 and 19-3a. Show the journal entry here. (6 points) Date Debit Accounts Credit 4. Move to the Retained Earnings Column. Show the journal entry to close out net income to Retained Earnings. (6 points) Date Accounts Debit Credit 5. Show the journal to record the declaration of cash dividends. The amount declared is $2,915 on the statement of equity. The amount actually paid on the cash flow statement is $2,905. Show journal entry here (6 points) Accounts Date Note-we will ignore the $1 mil reduction in Retained Earnings on the Treasury Stock/other line. We aren't given enough information to re-create this journal entry. 7. We can move to the Treasury Stock Column next. We see that treasury stock was purchased. Notice that the change in the Treasury Stock account equals the cash received from sale of common stock on the cash flow statement. Show the journal entry for the purchase of treasury stock. (6 points) Date Accounts Debit I'll do the foreign currency translation adjustment: Date Accounts Debit 8. Move on to the Accumulated Other Comprehensive Income/ (Loss) column. The total change is $407 mil. Remember there are four items that are charged to Other Comprehensive Income. To find the break-down of the $407 mil go to the Consolidated Statement of Comprehensive Income. Other comprehensive loss-foreign currency Payables (accounts payable) You do the marketable securities adjustment. (4 points) Date Accounts Marketable Securities Other comprehensive income-Derivatives Credit Debit 523 Debit Credit Debit 183 Credit 523 I'll take the derivatives adjustment as well, although we are just 2 weeks away from learning this. I will make the adjustment to marketable securities Date Accounts Credit Credit 183 Balance at December 31, 2015 Net income Other comprehensive income/(loss), net of tax Common stock issued (including share-based compensation impacts) Treasury stock/other Cash dividends declared (a) Balance at December 31, 2016 Balance at December 31, 2016 Adoption of accounting standards Net income Other comprehensive income/(loss), net of tax Common stock issued (including share-based compensation impacts) Treasury stock/other Cash dividends declared (a) Balance at December 31, 2017 Balance at December 31, 2017 Net income Other comprehensive income/(loss), net of tax Common stock issued (including share-based compensation impacts) Treasury stock/other Dividend and dividend equivalents declared (a) Balance at December 31, 2018 S S S S Capital Stock 41 $ | | 41 S 41 - FORD MOTOR COMPANY AND SUBSIDIARIES CONSOLIDATED STATEMENT OF EQUITY (in millions) Equity Attributable to Ford Motor Company Cap. in Excess of Par Value of Stock $ 21,421 41 S 21,630 6 - 209 S 21,630 41 $ 207 S 21,843 41 $ 21,843 - 163 22,006 Retained Earnings/(Accumulated Deficit) S S S S $ 14,980 4,589 (3,376) 16.193 16,193 566 7,731 (2,584) 21,906 21,906 3,677 (2,915) 22,668 Accumulated Other Comprehensive Income/(Loss) (Note 21) S S S S $ $ (6,257) S (756) (7,013) S 54 (6,959) S (6,959) $ (7,013) S (1,122) (407) Treasury Stock (7,366) $ (977) 209 (145) (3,376) (1,122) $ 29,729 (145) || (a) We declared dividends per share of Common and Class B Stock of $0.85, $0.65, and $0.73 per share in 2016, 2017, and 2018, respectively. The accompanying notes are part of the consolidated financial statements. (131) - (1.253) S (1,253) $ - Total $ 29,208 4,589 (756) - (164) (1,417) $ $ 29,729 572 7,731 54 207 (131) (2,584) 35,578 35,578 3,677 (407) 163 (164) (2,915) 35,932 S S S $ $ $ Equity Attributable to Non- controlling Interests 15 11 (1) (3) (5) 17 - 17 S 26 (2) (2) 28 18 $ (11) 28 S - (12) 34 Total Equity 209 (148) (3,381) $ 29,746 $ 29,223 4,600 (757) 29,746 572 7,757 52 207 (133) (2,595) 35,606 35,606 3,695 (407) 163 (164) (2,927) $ 35,966 Revenues Automotive Ford Credit Mobility Total revenues (Note 4) Costs and expenses Cost of sales Selling, administrative, and other expenses Ford Credit interest, operating, and other expenses Total costs and expenses Interest expense on Automotive debt Interest expense on Other debt Other income/(loss), net (Note 5) Equity in net income of affiliated companies Income before income taxes Provision for/(Benefit from) income taxes (Note 7) Net income Less: Income/(Loss) attributable to noncontrolling interests Net income attributable to Ford Motor Company FORD MOTOR COMPANY AND SUBSIDIARIES CONSOLIDATED INCOME STATEMENT (in millions, except per share amounts) EARNINGS PER SHARE ATTRIBUTABLE TO FORD MOTOR COMPANY COMMON AND CLASS B STOCK (Note 8) Basic income Diluted income S S 2016 For the years ended December 31, 2017 141,546 S 10,253 1 151,800 126,195 10,972 8,847 146,014 894 57 169 1,780 6,784 2,184 4,600 11 4,589 1.16 1.15 S S 145.653 $ 11,113 10 156,776 131,321 11,527 9,047 151,895 1,133 57 3,267 1,201 8,159 402 7,757 26 7,731 1.94 1.93 $ $ 2018 148,294 12,018 26 160,338 136,269 11,403 9,463 157,135 1,171 57 2,247 123 4,345 650 3,695 18 3,677 0.93 0.92 Net income Other comprehensive income/(loss), net of tax (Note 21) Foreign currency translation Marketable securities Derivative instruments Pension and other postretirement benefits Total other comprehensive income/(loss), net of tax Comprehensive income CONSOLIDATED STATEMENT OF COMPREHENSIVE INCOME (in millions) ess: Comprehensive income/(loss) attributable to noncontrolling interests Comprehensive income attributable to Ford Motor Company S FS-3 S 2016 The accompanying notes are part of the consolidated financial statements. For the years ended December 31 2017 4.600 $ (1,024) (8) 219 56 (757) 3,843 10 3,833 S 7,757 314 (34) (265) 37 52 7,809 24 7,785 $ $ 2018 3,695 (523) (11) 183 (56) (407) 3,288 18 3,270 FORD MOTOR COMPANY AND SUBSIDIARIES CONSOLIDATED BALANCE SHEET (in millions) ASSETS Cash and cash equivalents (Note 9) Marketable securities (Note 9) Ford Credit finance receivables, net (Note 10) Trade and other receivables, less allowances of $412 and $94 Inventories (Note 12) Other assets Total current assets Ford Credit finance receivables, net (Note 10) Net investment in operating leases (Note 13) Net property (Note 14) Equity in net assets of affiliated companies (Note 15) Deferred income taxes (Note 7) Other assets Total assets LIABILITIES Payables Other liabilities and deferred revenue (Note 16) Automotive debt payable within one year (Note 18) Ford Credit debt payable within one year (Note 18) Total current liabilities Other liabilities and deferred revenue (Note 16) Automotive long-term debt (Note 18) Ford Credit long-term debt (Note 18) Other long-term debt (Note 18) Deferred income taxes (Note 7) Total liabilities Redeemable noncontrolling interest (Note 20) EQUITY Common Stock, par value $.01 per share (4,000 million shares issued of 6 billion authorized) Class B Stock, par value $.01 per share (71 million shares issued of 530 million authorized) Capital in excess of par value of stock Retained earnings Accumulated other comprehensive income/(loss) (Note 21) Treasury stock Total equity attributable to Ford Motor Company Equity attributable to noncontrolling interests Total equity Total liabilities and equity $ $ $ $ December 31, 2017 18,492 $ 20,435 52,210 10,599 11,178 3,889 116,801 56,182 28,235 35,327 3,085 10,762 8,104 258,498 $ 23,282 $ 19,697 3,358 48,285 94,600 24,711 12,575 89,492 599 815 222,792 98 40 December 31, 2018 1 21,843 21,908 (6,959) (1,253) 35,578 28 35,600 258,498 $ 16,718 17,233 54,353 11,195 11,220 3,930 114,649 55,544 29,119 36,178 2,709 10,412 7,929 256,540 21,520 20,556 2,314 51,179 95,569 23,588 11,233 88,887 600 597 220,474 100 40 1 22,006 22,668 (7,366) (1,417) 35,932 34 35,966 256,540 Cash flows from operating activities Net income Depreciation and tooling amortization Other amortization Provision for credit and insurance losses Pension and other postretirement employee benefits ("OPEB") expense/(income) Equity investment (earnings Mosses in excess of dividends received Foreign currency adjustments FORD MOTOR COMPANY AND SUBSIDIARIES CONSOLIDATED STATEMENT OF CASH FLOWS (in millions) Net (gainMloss on changes in investments in affiliates Stock compensation Net change in wholesale and other receivables Provision for deferred income taxes Decrease/(Increase) in accounts receivable and other assets Decrease/(Increase) in inventory Increase/(Decrease) in accounts payable and accrued and other liabilities Other Net cash provided by/(used in) operating activities Cash flows from investing activities Capital spending Acquisitions of finance receivables and operating leases Collections of finance receivables and operating leases Purchases of marketable and other securities Sales and maturities of marketable and other securities Settlements of derivatives Other Net cash provided by/(used in) investing activities Cash flows from financing activities Cash dividends Purchases of common stock Net changes in short-term debt Proceeds from issuance of long-term debt Principal payments on long-term debt Other Net cash provided by/(used in) financing activities Effect of exchange rate changes on cash, cash equivalents, and restricted cash Net increase/(decrease) in cash, cash equivalents, and restricted cash Cash, cash equivalents, and restricted cash at January 1 (Note 9) Net increase/(decrease) in cash, cash equivalents, and restricted cash Cash, cash equivalents, and restricted cash at December 31 (Note 9) $ $ $ $ For the years ended December 31, 2017 2016 4,600 9,023 (306) 672 2,867 (178) 283 (139) 210 (1,449) 1,473 (2,855) (803) 6,595 57 19,850 (6,992) (56,007) 38,834 (31,428) 29,354 825 112 (25,302) (3,376) (145) 3,864 45,961 (38,797) (107) 7,400 (265) 1,883 $ The accompanying notes are part of the consolidated financial statements. $ 14,336 1,683 16,019 $ $ 7,757 $ 9,122 (669) 717 (608) 240 (403) (7) 248 (838) (350) (2,297) (970) 6,089 65 18,098 (7,049) (59,354) 44,641 (27,567) 29,898 100 (29) (19,360) (2,584) (131) 1,229 45,801 (40,770) (151) 3,394 489 2,819 $ 16,019 $ 2,619 18,638 $ 2018 3,695 9,280 (972) 609 400 206 529 (42) 191 (2,408) (197) (2,239) (828) 6,781 17 15,022 (7,785) (62,924) 50,880 (17,140) 20,527 358 (177) (16,261) (2,905) (16 (2,819) 50,130 (44,172) (192) (122) (370) (1.731) 18,638 (1,731) 16,907 NOTE 6. SHARE-BASED COMPENSATION Under our Long-Term Incentive Plans, we may issue restricted stock units ("RSUS"), restricted stock shares ("RSSs"), and stock options. RSUS and RSSs consist of time-based and performance-based awards. The number of shares that may be granted in any year is limited to 2% of our issued and outstanding Common Stock as of December 31 of the prior calendar year. The limit may be increased up to 3% in any year, with a corresponding reduction in shares available for grants in future years. Granted RSUS generally cliff vest or ratably vest over a three-year service period. Performance- based RSUS have two components: one based on internal financial performance metrics, and the other based on total shareholder return relative to an industrial and automotive peer group. At the time of vest, RSU awards are net settled (shares are withheld to cover the employee tax obligation). The fair value of both the time-based and the internal performance metrics portion of the performance-based RSUS and RSSS is determined using the closing price of our Common Stock at grant date. The weighted average per unit grant date fair value for the years ended December 31, 2016, 2017, and 2018 was $13.54, $12.37, and $9.89, respectively. The fair value of time-based RSUS and RSSS is expensed over the shorter of the vesting period, using the graded vesting method, or the time period an employee becomes eligible to retain the award at retirement. The fair value of performance-based RSUS and RSSS is expensed when it is probable and estimable as measured against the performance metrics over the shorter of the performance or required service periods. We have elected to recognize forfeitures as an adjustment to compensation expense for all RSUS and RSSS in the same period as the forfeitures occur. Expense is recorded in Selling, administrative, and other expenses. The fair value of vested RSUS and RSSS as well as the compensation cost for the years ended December 31 was as follows (in millions): Fair value of vested shares Compensation cost (a) (3) Net of tax benefit of $72 million, $52 million, and $29 million in 2016, 2017, and 2018, respectively. Fair value per stock award Grant date stock price Assumptions: 2016 $ Ford's stock price expected volatility (a) Expected average volatility of peer companies (a) Risk-free interest rate Dividend yield Outstanding, beginning of year Granted 157 $ 135 As of December 31, 2018, there was approximately $146 million in unrecognized compensation cost related to non- vested RSUS and RSSs. This expense will be recognized over a weighted average period of 1.9 years. $ The performance-based RSUs granted in March 2016, 2017, and 2018 include a relative Total Shareholder Return (TSR) metric. We estimate the fair value of the TSR component of the performance-based RSUS using a Monte Carlo simulation. Inputs and assumptions used to calculate the fair value at grant date were as follows: 2016 2017 15.50 13.54 23.1% 28.4 0.98 4.43 175 $ 193 $ 2017 Shares 12.44 12.68 23.4% 28.0 1.57 4.74 (a) Expected volatility based on three years of daily closing share price changes ending on the grant date. During 2018, activity for RSUS and RSSs was as follows (in millions, except for weighted average fair value): 44.4 37.7 2018 $ $ 187 162 2018 9.03 10.40 22.9% 25.4 2.48 5.00 Weighted- Average Fair Value 13.32 9.89 Vested Forfeited Outstanding, end of year The table above also includes shares awarded to non-employee directors. At December 31, 2018, there were 684,461 shares vested, but unissued. Stock Options As of March 31, 2017, all of our outstanding stock options were fully vested. The last of our outstanding stock options will expire in July 2024, if not exercised sooner. We measure the fair value of our stock options using the Black-Scholes option-pricing model and record expense in Selling, administrative, and other expenses. NOTE 8. CAPITAL STOCK AND EARNINGS PER SHARE All general voting power is vested in the holders of Common Stock and Class B Stock. Holders of our Common Stock have 60% of the general voting power and holders of our Class B Stock are entitled to such number of votes per share as will give them the remaining 40%. Shares of Common Stock and Class B Stock share equally in dividends when and as paid, with stock dividends payable in shares of stock of the class held. Earnings Per Share Attributable to Ford Motor Company Common and Class B Stock Basic and diluted income per share were calculated using the following (in millions): 2016 If liquidated, each share of Common Stock is entitled to the first $0.50 available for distribution to holders of Common Stock and Class B Stock, each share of Class B Stock is entitled to the next $1.00 so available, each share of Common Stock is entitled to the next $0.50 so available, and each share of Common and Class B Stock is entitled to an equal amount thereafter. Basic and Diluted Income Attributable to Ford Motor Company Basic income Diluted income (13.7) (4.3) We present both basic and diluted earnings per share ("EPS") amounts in our financial reporting. Basic EPS excludes dilution and is computed by dividing income available to Common and Class B Stock holders by the weighted-average number of Common and Class B Stock outstanding for the period. Diluted EPS reflects the maximum potential dilution that could occur from our share-based compensation, including "in-the-money" stock options, unvested restricted stock units, and unvested restricted stock shares. Potentially dilutive shares are excluded from the calculation if they have an anti-dilutive effect in the period. Basic and Diluted Shares Basic shares (average shares outstanding) Net dilutive options, unvested restricted stock units, and unvested restricted stock shares Diluted shares $ 84.1 4,589 4,589 3,973 28 3.999 $ 13.68 13.85 10.80 2017 7.731 $ 7,731 3,975 23 3.998 2018 3,677 3,677 3,974 24 3.998 The purpose of this case is to show our understanding of the Statement of Stockholders' Equity by re-creating the journal entries that would have occurred based upon the information from the financial statements. Financial statement information is available in the file entitled, "Case 3 Reference.214." The case is worth 40 points as indicated. Let's start by looking at the heading of the Consolidated Statement of Equity for Ford Motor Company and its Subsidiaries. 1. The heading of the statement is not quite clear. You may need to refer to the text. What is the date of the statement for the most current year? Is it for a period of time or at a point in time? Explain. (4 points) The most current year is 2018. It is a period of time spanning 3 years 2016 to 2018 2. Each column heading represents a line item in the Equity section of the Balance Sheet. However, there are seven line items on the Balance Sheet and only six columns. What items were combined on the Equity Statement? Why do you think Ford combined the two items? (4 points) Let's journalize. Only prepare journal entries for the most current year. 3. Start with the Capital Stock and Capital in Excess of Par Value columns on the Consolidated Statement of Equity for Ford Motor Company. We see that Capital in Excess of Part increased $163 mill, but the par value account did not change. We can also see on the cash flow statement that no stock was issued. Since the line item says that the increase to the account includes share-based compensation impacts, we will assume that the entire amount is for share-based compensation. The entry would be similar to Illustration 19-3 and 19-3a. Show the journal entry here. (6 points) Date Debit Accounts Credit 4. Move to the Retained Earnings Column. Show the journal entry to close out net income to Retained Earnings. (6 points) Date Accounts Debit Credit 5. Show the journal to record the declaration of cash dividends. The amount declared is $2,915 on the statement of equity. The amount actually paid on the cash flow statement is $2,905. Show journal entry here (6 points) Accounts Date Note-we will ignore the $1 mil reduction in Retained Earnings on the Treasury Stock/other line. We aren't given enough information to re-create this journal entry. 7. We can move to the Treasury Stock Column next. We see that treasury stock was purchased. Notice that the change in the Treasury Stock account equals the cash received from sale of common stock on the cash flow statement. Show the journal entry for the purchase of treasury stock. (6 points) Date Accounts Debit I'll do the foreign currency translation adjustment: Date Accounts Debit 8. Move on to the Accumulated Other Comprehensive Income/ (Loss) column. The total change is $407 mil. Remember there are four items that are charged to Other Comprehensive Income. To find the break-down of the $407 mil go to the Consolidated Statement of Comprehensive Income. Other comprehensive loss-foreign currency Payables (accounts payable) You do the marketable securities adjustment. (4 points) Date Accounts Marketable Securities Other comprehensive income-Derivatives Credit Debit 523 Debit Credit Debit 183 Credit 523 I'll take the derivatives adjustment as well, although we are just 2 weeks away from learning this. I will make the adjustment to marketable securities Date Accounts Credit Credit 183 Balance at December 31, 2015 Net income Other comprehensive income/(loss), net of tax Common stock issued (including share-based compensation impacts) Treasury stock/other Cash dividends declared (a) Balance at December 31, 2016 Balance at December 31, 2016 Adoption of accounting standards Net income Other comprehensive income/(loss), net of tax Common stock issued (including share-based compensation impacts) Treasury stock/other Cash dividends declared (a) Balance at December 31, 2017 Balance at December 31, 2017 Net income Other comprehensive income/(loss), net of tax Common stock issued (including share-based compensation impacts) Treasury stock/other Dividend and dividend equivalents declared (a) Balance at December 31, 2018 S S S S Capital Stock 41 $ | | 41 S 41 - FORD MOTOR COMPANY AND SUBSIDIARIES CONSOLIDATED STATEMENT OF EQUITY (in millions) Equity Attributable to Ford Motor Company Cap. in Excess of Par Value of Stock $ 21,421 41 S 21,630 6 - 209 S 21,630 41 $ 207 S 21,843 41 $ 21,843 - 163 22,006 Retained Earnings/(Accumulated Deficit) S S S S $ 14,980 4,589 (3,376) 16.193 16,193 566 7,731 (2,584) 21,906 21,906 3,677 (2,915) 22,668 Accumulated Other Comprehensive Income/(Loss) (Note 21) S S S S $ $ (6,257) S (756) (7,013) S 54 (6,959) S (6,959) $ (7,013) S (1,122) (407) Treasury Stock (7,366) $ (977) 209 (145) (3,376) (1,122) $ 29,729 (145) || (a) We declared dividends per share of Common and Class B Stock of $0.85, $0.65, and $0.73 per share in 2016, 2017, and 2018, respectively. The accompanying notes are part of the consolidated financial statements. (131) - (1.253) S (1,253) $ - Total $ 29,208 4,589 (756) - (164) (1,417) $ $ 29,729 572 7,731 54 207 (131) (2,584) 35,578 35,578 3,677 (407) 163 (164) (2,915) 35,932 S S S $ $ $ Equity Attributable to Non- controlling Interests 15 11 (1) (3) (5) 17 - 17 S 26 (2) (2) 28 18 $ (11) 28 S - (12) 34 Total Equity 209 (148) (3,381) $ 29,746 $ 29,223 4,600 (757) 29,746 572 7,757 52 207 (133) (2,595) 35,606 35,606 3,695 (407) 163 (164) (2,927) $ 35,966 Revenues Automotive Ford Credit Mobility Total revenues (Note 4) Costs and expenses Cost of sales Selling, administrative, and other expenses Ford Credit interest, operating, and other expenses Total costs and expenses Interest expense on Automotive debt Interest expense on Other debt Other income/(loss), net (Note 5) Equity in net income of affiliated companies Income before income taxes Provision for/(Benefit from) income taxes (Note 7) Net income Less: Income/(Loss) attributable to noncontrolling interests Net income attributable to Ford Motor Company FORD MOTOR COMPANY AND SUBSIDIARIES CONSOLIDATED INCOME STATEMENT (in millions, except per share amounts) EARNINGS PER SHARE ATTRIBUTABLE TO FORD MOTOR COMPANY COMMON AND CLASS B STOCK (Note 8) Basic income Diluted income S S 2016 For the years ended December 31, 2017 141,546 S 10,253 1 151,800 126,195 10,972 8,847 146,014 894 57 169 1,780 6,784 2,184 4,600 11 4,589 1.16 1.15 S S 145.653 $ 11,113 10 156,776 131,321 11,527 9,047 151,895 1,133 57 3,267 1,201 8,159 402 7,757 26 7,731 1.94 1.93 $ $ 2018 148,294 12,018 26 160,338 136,269 11,403 9,463 157,135 1,171 57 2,247 123 4,345 650 3,695 18 3,677 0.93 0.92 Net income Other comprehensive income/(loss), net of tax (Note 21) Foreign currency translation Marketable securities Derivative instruments Pension and other postretirement benefits Total other comprehensive income/(loss), net of tax Comprehensive income CONSOLIDATED STATEMENT OF COMPREHENSIVE INCOME (in millions) ess: Comprehensive income/(loss) attributable to noncontrolling interests Comprehensive income attributable to Ford Motor Company S FS-3 S 2016 The accompanying notes are part of the consolidated financial statements. For the years ended December 31 2017 4.600 $ (1,024) (8) 219 56 (757) 3,843 10 3,833 S 7,757 314 (34) (265) 37 52 7,809 24 7,785 $ $ 2018 3,695 (523) (11) 183 (56) (407) 3,288 18 3,270 FORD MOTOR COMPANY AND SUBSIDIARIES CONSOLIDATED BALANCE SHEET (in millions) ASSETS Cash and cash equivalents (Note 9) Marketable securities (Note 9) Ford Credit finance receivables, net (Note 10) Trade and other receivables, less allowances of $412 and $94 Inventories (Note 12) Other assets Total current assets Ford Credit finance receivables, net (Note 10) Net investment in operating leases (Note 13) Net property (Note 14) Equity in net assets of affiliated companies (Note 15) Deferred income taxes (Note 7) Other assets Total assets LIABILITIES Payables Other liabilities and deferred revenue (Note 16) Automotive debt payable within one year (Note 18) Ford Credit debt payable within one year (Note 18) Total current liabilities Other liabilities and deferred revenue (Note 16) Automotive long-term debt (Note 18) Ford Credit long-term debt (Note 18) Other long-term debt (Note 18) Deferred income taxes (Note 7) Total liabilities Redeemable noncontrolling interest (Note 20) EQUITY Common Stock, par value $.01 per share (4,000 million shares issued of 6 billion authorized) Class B Stock, par value $.01 per share (71 million shares issued of 530 million authorized) Capital in excess of par value of stock Retained earnings Accumulated other comprehensive income/(loss) (Note 21) Treasury stock Total equity attributable to Ford Motor Company Equity attributable to noncontrolling interests Total equity Total liabilities and equity $ $ $ $ December 31, 2017 18,492 $ 20,435 52,210 10,599 11,178 3,889 116,801 56,182 28,235 35,327 3,085 10,762 8,104 258,498 $ 23,282 $ 19,697 3,358 48,285 94,600 24,711 12,575 89,492 599 815 222,792 98 40 December 31, 2018 1 21,843 21,908 (6,959) (1,253) 35,578 28 35,600 258,498 $ 16,718 17,233 54,353 11,195 11,220 3,930 114,649 55,544 29,119 36,178 2,709 10,412 7,929 256,540 21,520 20,556 2,314 51,179 95,569 23,588 11,233 88,887 600 597 220,474 100 40 1 22,006 22,668 (7,366) (1,417) 35,932 34 35,966 256,540 Cash flows from operating activities Net income Depreciation and tooling amortization Other amortization Provision for credit and insurance losses Pension and other postretirement employee benefits ("OPEB") expense/(income) Equity investment (earnings Mosses in excess of dividends received Foreign currency adjustments FORD MOTOR COMPANY AND SUBSIDIARIES CONSOLIDATED STATEMENT OF CASH FLOWS (in millions) Net (gainMloss on changes in investments in affiliates Stock compensation Net change in wholesale and other receivables Provision for deferred income taxes Decrease/(Increase) in accounts receivable and other assets Decrease/(Increase) in inventory Increase/(Decrease) in accounts payable and accrued and other liabilities Other Net cash provided by/(used in) operating activities Cash flows from investing activities Capital spending Acquisitions of finance receivables and operating leases Collections of finance receivables and operating leases Purchases of marketable and other securities Sales and maturities of marketable and other securities Settlements of derivatives Other Net cash provided by/(used in) investing activities Cash flows from financing activities Cash dividends Purchases of common stock Net changes in short-term debt Proceeds from issuance of long-term debt Principal payments on long-term debt Other Net cash provided by/(used in) financing activities Effect of exchange rate changes on cash, cash equivalents, and restricted cash Net increase/(decrease) in cash, cash equivalents, and restricted cash Cash, cash equivalents, and restricted cash at January 1 (Note 9) Net increase/(decrease) in cash, cash equivalents, and restricted cash Cash, cash equivalents, and restricted cash at December 31 (Note 9) $ $ $ $ For the years ended December 31, 2017 2016 4,600 9,023 (306) 672 2,867 (178) 283 (139) 210 (1,449) 1,473 (2,855) (803) 6,595 57 19,850 (6,992) (56,007) 38,834 (31,428) 29,354 825 112 (25,302) (3,376) (145) 3,864 45,961 (38,797) (107) 7,400 (265) 1,883 $ The accompanying notes are part of the consolidated financial statements. $ 14,336 1,683 16,019 $ $ 7,757 $ 9,122 (669) 717 (608) 240 (403) (7) 248 (838) (350) (2,297) (970) 6,089 65 18,098 (7,049) (59,354) 44,641 (27,567) 29,898 100 (29) (19,360) (2,584) (131) 1,229 45,801 (40,770) (151) 3,394 489 2,819 $ 16,019 $ 2,619 18,638 $ 2018 3,695 9,280 (972) 609 400 206 529 (42) 191 (2,408) (197) (2,239) (828) 6,781 17 15,022 (7,785) (62,924) 50,880 (17,140) 20,527 358 (177) (16,261) (2,905) (16 (2,819) 50,130 (44,172) (192) (122) (370) (1.731) 18,638 (1,731) 16,907 NOTE 6. SHARE-BASED COMPENSATION Under our Long-Term Incentive Plans, we may issue restricted stock units ("RSUS"), restricted stock shares ("RSSs"), and stock options. RSUS and RSSs consist of time-based and performance-based awards. The number of shares that may be granted in any year is limited to 2% of our issued and outstanding Common Stock as of December 31 of the prior calendar year. The limit may be increased up to 3% in any year, with a corresponding reduction in shares available for grants in future years. Granted RSUS generally cliff vest or ratably vest over a three-year service period. Performance- based RSUS have two components: one based on internal financial performance metrics, and the other based on total shareholder return relative to an industrial and automotive peer group. At the time of vest, RSU awards are net settled (shares are withheld to cover the employee tax obligation). The fair value of both the time-based and the internal performance metrics portion of the performance-based RSUS and RSSS is determined using the closing price of our Common Stock at grant date. The weighted average per unit grant date fair value for the years ended December 31, 2016, 2017, and 2018 was $13.54, $12.37, and $9.89, respectively. The fair value of time-based RSUS and RSSS is expensed over the shorter of the vesting period, using the graded vesting method, or the time period an employee becomes eligible to retain the award at retirement. The fair value of performance-based RSUS and RSSS is expensed when it is probable and estimable as measured against the performance metrics over the shorter of the performance or required service periods. We have elected to recognize forfeitures as an adjustment to compensation expense for all RSUS and RSSS in the same period as the forfeitures occur. Expense is recorded in Selling, administrative, and other expenses. The fair value of vested RSUS and RSSS as well as the compensation cost for the years ended December 31 was as follows (in millions): Fair value of vested shares Compensation cost (a) (3) Net of tax benefit of $72 million, $52 million, and $29 million in 2016, 2017, and 2018, respectively. Fair value per stock award Grant date stock price Assumptions: 2016 $ Ford's stock price expected volatility (a) Expected average volatility of peer companies (a) Risk-free interest rate Dividend yield Outstanding, beginning of year Granted 157 $ 135 As of December 31, 2018, there was approximately $146 million in unrecognized compensation cost related to non- vested RSUS and RSSs. This expense will be recognized over a weighted average period of 1.9 years. $ The performance-based RSUs granted in March 2016, 2017, and 2018 include a relative Total Shareholder Return (TSR) metric. We estimate the fair value of the TSR component of the performance-based RSUS using a Monte Carlo simulation. Inputs and assumptions used to calculate the fair value at grant date were as follows: 2016 2017 15.50 13.54 23.1% 28.4 0.98 4.43 175 $ 193 $ 2017 Shares 12.44 12.68 23.4% 28.0 1.57 4.74 (a) Expected volatility based on three years of daily closing share price changes ending on the grant date. During 2018, activity for RSUS and RSSs was as follows (in millions, except for weighted average fair value): 44.4 37.7 2018 $ $ 187 162 2018 9.03 10.40 22.9% 25.4 2.48 5.00 Weighted- Average Fair Value 13.32 9.89 Vested Forfeited Outstanding, end of year The table above also includes shares awarded to non-employee directors. At December 31, 2018, there were 684,461 shares vested, but unissued. Stock Options As of March 31, 2017, all of our outstanding stock options were fully vested. The last of our outstanding stock options will expire in July 2024, if not exercised sooner. We measure the fair value of our stock options using the Black-Scholes option-pricing model and record expense in Selling, administrative, and other expenses. NOTE 8. CAPITAL STOCK AND EARNINGS PER SHARE All general voting power is vested in the holders of Common Stock and Class B Stock. Holders of our Common Stock have 60% of the general voting power and holders of our Class B Stock are entitled to such number of votes per share as will give them the remaining 40%. Shares of Common Stock and Class B Stock share equally in dividends when and as paid, with stock dividends payable in shares of stock of the class held. Earnings Per Share Attributable to Ford Motor Company Common and Class B Stock Basic and diluted income per share were calculated using the following (in millions): 2016 If liquidated, each share of Common Stock is entitled to the first $0.50 available for distribution to holders of Common Stock and Class B Stock, each share of Class B Stock is entitled to the next $1.00 so available, each share of Common Stock is entitled to the next $0.50 so available, and each share of Common and Class B Stock is entitled to an equal amount thereafter. Basic and Diluted Income Attributable to Ford Motor Company Basic income Diluted income (13.7) (4.3) We present both basic and diluted earnings per share ("EPS") amounts in our financial reporting. Basic EPS excludes dilution and is computed by dividing income available to Common and Class B Stock holders by the weighted-average number of Common and Class B Stock outstanding for the period. Diluted EPS reflects the maximum potential dilution that could occur from our share-based compensation, including "in-the-money" stock options, unvested restricted stock units, and unvested restricted stock shares. Potentially dilutive shares are excluded from the calculation if they have an anti-dilutive effect in the period. Basic and Diluted Shares Basic shares (average shares outstanding) Net dilutive options, unvested restricted stock units, and unvested restricted stock shares Diluted shares $ 84.1 4,589 4,589 3,973 28 3.999 $ 13.68 13.85 10.80 2017 7.731 $ 7,731 3,975 23 3.998 2018 3,677 3,677 3,974 24 3.998
Expert Answer:
Answer rating: 100% (QA)
1 Date of the Statement The Consolidated Statement of Equity for Ford Motor Company and its Subsidia... View the full answer

Related Book For 

Operations management in the supply chain decisions and cases
ISBN: 978-0077835439
7th edition
Authors: Roger G Schroeder, M. Johnny Rungtusanatham, Susan Meyer Goldstein
Posted Date:
Students also viewed these accounting questions
-
The purpose of this case is to come up with a contingency plan[s] in order to sustain the program Move With Me, a program that serves thousands of community members throughout Lower Manhattan. The...
-
In E2-13, prepare any journal entries that would have been different if the only trigger points had been the purchase of materials and the sale of finished goods.
-
For E prepare any journal entries that would have been different if the only trigger points had been the purchase of materials and the sale of finished goods. In E, a. Purchased raw materials, on...
-
(8) (Non circular cylinder) A solid right (noncircular) cylinder has its base the R in the xy-plane and is bounded above by is 22-y + +5 5 * (x + y) dx dy paraboloid 2= x + y . The cylinder's volume....
-
Presented below are the 2013 income statement and comparative balance sheets for Santana Industries. Additional information for the 2013 fiscal year ($ in thousands): 1. Cash dividends of $1,000 were...
-
Repeat problem 9-2-4 [OUW] to determine (a) the maximum rate at which process heat can be supplied.
-
Direct deposit both reduces the costs of and improves control over payroll dis tribution. Does this mean that companies should require all their employees to be paid by direct deposit? Why or why not?
-
Back Mountain Industries (BMI) has two divisions: East and West. BMI has a cost-of-capital of 15%. Selected financial information (in thousands of dollars) for the first year of business follows: a...
-
these are my options: Debit Sales 399.90, Credit Accounts receivable/ABC Warehouse 399.90 Debit Purchase 399.90, Credit Accounts payable/ABC Warehouse 399.90 Debit Cash 399.90, Credit Sales 399.90...
-
How could B/C analysis be used to help determine the level of subsidy to be paid to the operator of public transportation services in a congested urban area?
-
direction) at point B which is at a distance of d/2 to the left of charge +Q. a. On the diagram shown, draw two electric field vectors at point B to represent the two separate electric fields created...
-
compare and contrast SQL Server and Oracle database management systems ?
-
2. What are some of the assets and limitations of traditional process families? 10. What is the role of bases and supports? 12. What are some limitations of the additive processes? 13. What is the...
-
A train traveling 60 mph is one mile from a crossing, and begins decelerating until it is travelling only 30 mph by the time it reaches the crossing. Determine the time (in seconds) that it takes to...
-
What is a physician quality reporting system (PQRS), now known as MIPS, and who created it? Distinguish between the two basic approaches to utilization management: Prospective review/precertification...
-
Do we need a MS SQL Server for a small to medium size organization, may be if their data needs are greater, an Oracle database?
-
Research more on one of the analytics applications mentioned in the Souza (2014) reading (see Tables 3-6). Comment on this analytics program explaining issue(s) you think was/was not...
-
The vapor pressure of the liquid NH, is measured at different temperatures. The following vapor pressure data are obtained. Temperature, K P, mmHg 217.1 223.4 234.7 588.1 Calculate the enthalpy of...
-
A line of furniture is made by the Drazal Company in South Carolina and is being considered for outsourcing to China. The unit manufacturing costs in the U.S. are: Unit Cost of Goods Sold Direct...
-
The Zomcast cable TV company is considering outsourcing its call center to the Philippines. The cost of hiring operators and staff in the Philippines is 60 percent of the salary and benefits paid in...
-
What services are provided by the following 3PL providers: C.H. Robinson, Ryder, and Penske Logistics?
-
Write your own version of the Convert To Adj Matrix [edgelist, n] command without options, which takes a list of edges of an undirected graph and the number of vertices in the graph, and returns the...
-
Find a directed spanning tree of the following graph if one exists. Is the tree unique? Do this by hand and not in Mathematica.
-
A complete undirected graph is a graph such that edges exist between every pair of vertices. Find an upper bound for the number of spanning trees a complete graph can have.

Study smarter with the SolutionInn App