

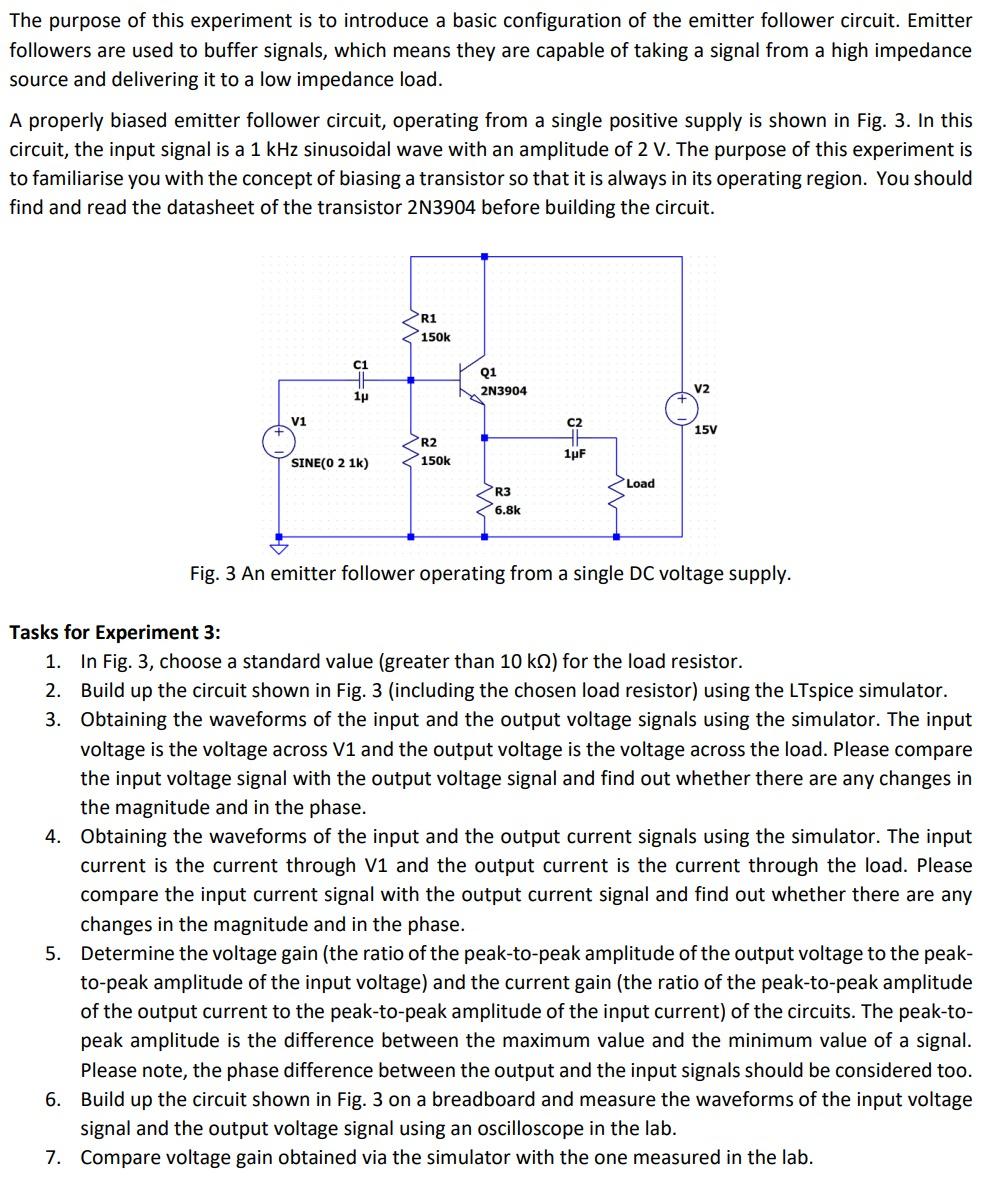
The purpose of this experiment is to introduce a basic configuration of the emitter follower circuit....
Fantastic news! We've Found the answer you've been seeking!
Question:
Expert Answer:
Here are the steps to complete the experiment 1 I chose 22k for the load resistor R3 which is a stan... View the full answer

Related Book For 

Posted Date:
