Answered step by step
Verified Expert Solution
Question
1 Approved Answer
The quality team at Rig Concrete Testing Company feel that the executive management team ignore the company's science related to wind tower foundation technology


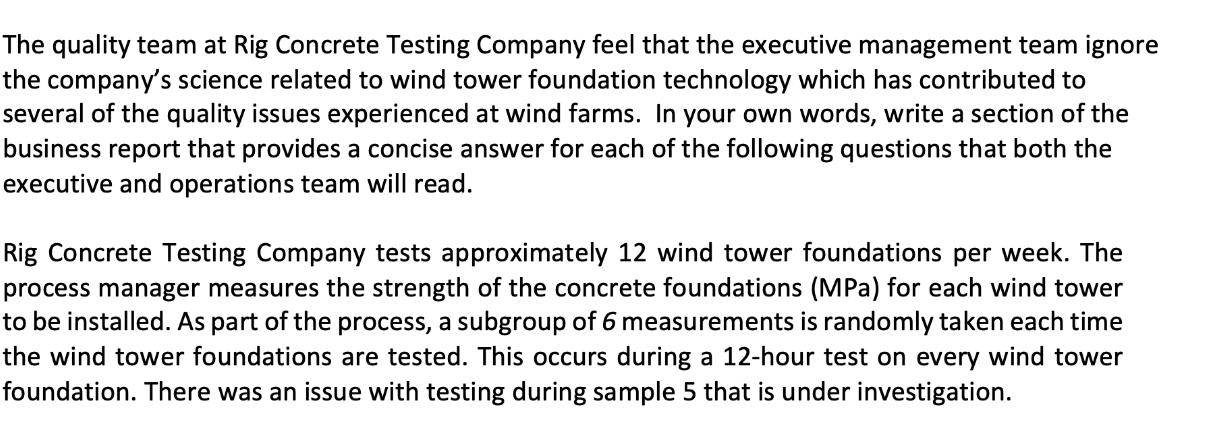
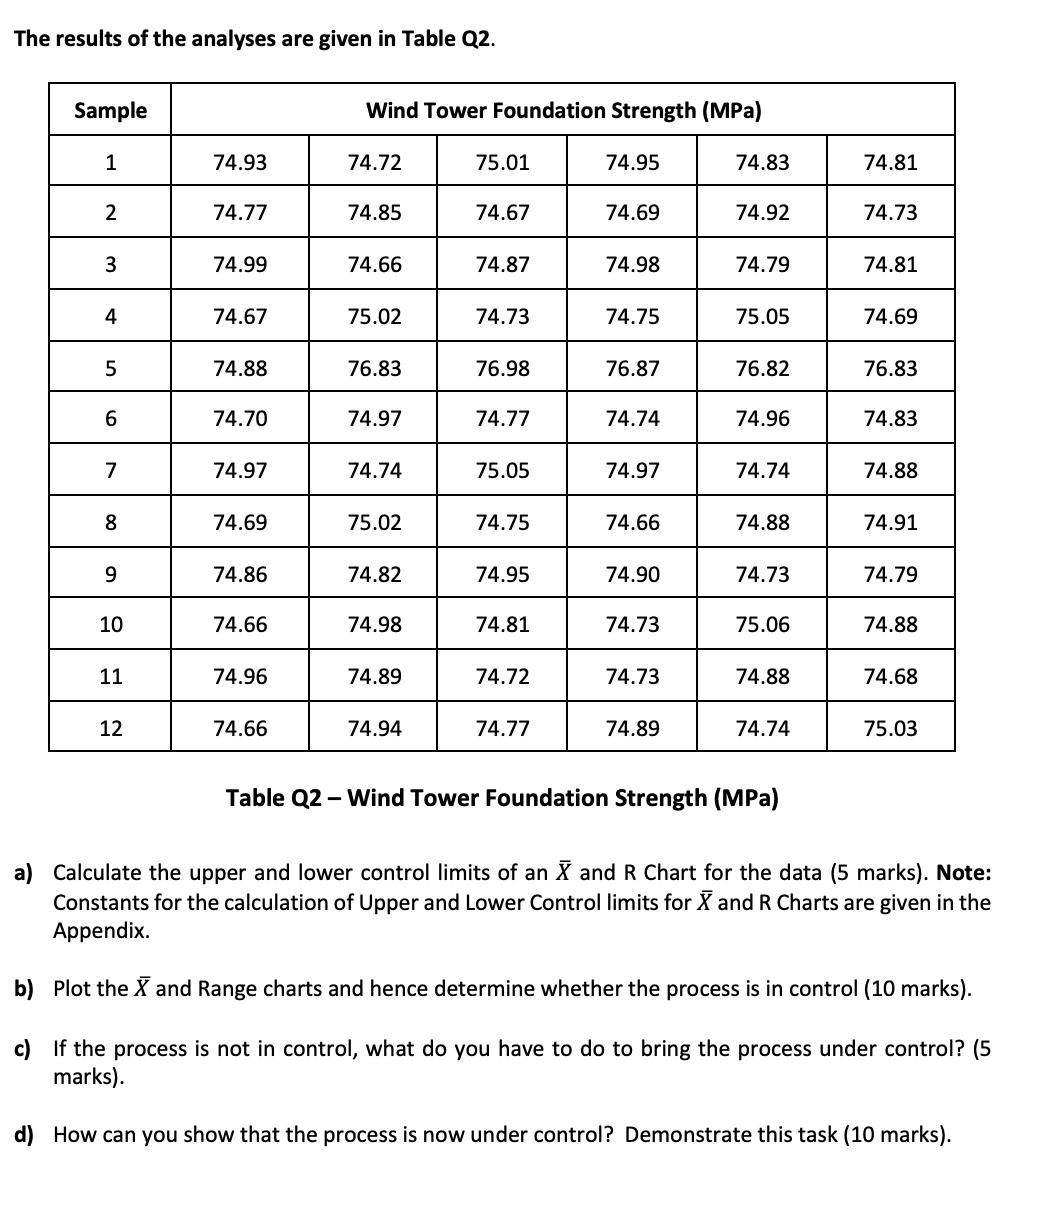
The quality team at Rig Concrete Testing Company feel that the executive management team ignore the company's science related to wind tower foundation technology which has contributed to several of the quality issues experienced at wind farms. In your own words, write a section of the business report that provides a concise answer for each of the following questions that both the executive and operations team will read. Rig Concrete Testing Company tests approximately 12 wind tower foundations per week. The process manager measures the strength of the concrete foundations (MPa) for each wind tower to be installed. As part of the process, a subgroup of 6 measurements is randomly taken each time the wind tower foundations are tested. This occurs during a 12-hour test on every wind tower foundation. There was an issue with testing during sample 5 that is under investigation. The results of the analyses are given in Table Q2. Sample 1 2 3 4 5 6 7 8 9 10 11 12 74.93 74.77 74.99 74.67 74.88 74.70 74.97 74.69 74.86 74.66 74.96 74.66 Wind Tower Foundation Strength (MPa) 74.72 74.85 74.66 75.02 76.83 74.97 74.74 75.02 74.82 74.98 74.89 74.94 75.01 74.67 74.87 74.73 76.98 74.77 75.05 74.75 74.95 74.81 74.72 74.77 74.95 74.69 74.98 74.75 76.87 74.74 74.97 74.66 74.90 74.73 74.73 74.89 74.83 74.92 74.79 75.05 76.82 74.96 74.74 74.88 74.73 75.06 74.88 74.74 Table Q2 - Wind Tower Foundation Strength (MPa) 74.81 74.73 74.81 74.69 76.83 74.83 74.88 74.91 74.79 74.88 74.68 75.03 a) Calculate the upper and lower control limits of an X and R Chart for the data (5 marks). Note: Constants for the calculation of Upper and Lower Control limits for X and R Charts are given in the Appendix. b) Plot the X and Range charts and hence determine whether the process is in control (10 marks). c) If the process is not in control, what do you have to do to bring the process under control? (5 marks). d) How can you show that the process is now under control? Demonstrate this task (10 marks).
Step by Step Solution
There are 3 Steps involved in it
Step: 1
Section of Business Report Quality Analysis of Wind Tower Foundation Strength a Calculation of Control Limits for X and R Chart To assess the quality ...
Get Instant Access to Expert-Tailored Solutions
See step-by-step solutions with expert insights and AI powered tools for academic success
Step: 2

Step: 3

Ace Your Homework with AI
Get the answers you need in no time with our AI-driven, step-by-step assistance
Get Started


