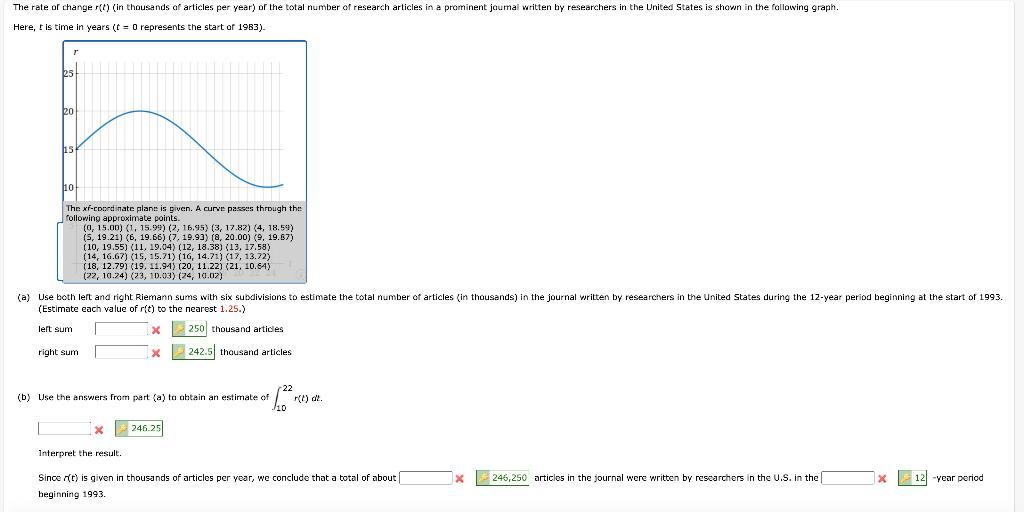
The rate of change r(t) (in thousands of articles per year) of the total number of...
Fantastic news! We've Found the answer you've been seeking!
Question:
Transcribed Image Text:
The rate of change r(t) (in thousands of articles per year) of the total number of research articles in a prominent jaumai written by researchers in the United States is shown in the fallowing graph. Here, t is time in years (t = 0 represents the start of 1983). 20 15 The xf-coordinate plane is given. A curve passes through the rollowing approximate points. (0, 15.00) (1, 15.99) (2, 16.95) (3, 17.82) (4, 18.59) (5, 19.21) (6, 19.66) (7, 19.93) (a, 20.00) (9, 19.87) (10, 19.55) (11, 19.04) (12, 18.38) (13, 17.58) (14, 16.67) (15, 15.71) (16, 14.71) (17, 13.72) (18, 12.79) (19, 11.94) (20, 11.2z) (21, 10.54) (22, 10.24) (23, 10.03) (24, 10.02) (a) Use both left and right Riemann sums with six subdivisions to estimate the total number of articles (in thousands) in the journal written by researchers in the United States during the 12-year period beginning at the start of 1993. (Estimate each value of r(t) to the nearest 1.25.) left sum 250 thousand articles right sum 242.5 thousand articles (b) Use the answers from part (a) to obtain an estirmate of r(t) dt. 246.25 Interpret the result. Since r(t) is given in thousands articles per year, we conclude that a total of about 246,250 articles in the journal were written by rescarchers in the U.S. in the 12 -year period beginning 1993. The rate of change r(t) (in thousands of articles per year) of the total number of research articles in a prominent jaumai written by researchers in the United States is shown in the fallowing graph. Here, t is time in years (t = 0 represents the start of 1983). 20 15 The xf-coordinate plane is given. A curve passes through the rollowing approximate points. (0, 15.00) (1, 15.99) (2, 16.95) (3, 17.82) (4, 18.59) (5, 19.21) (6, 19.66) (7, 19.93) (a, 20.00) (9, 19.87) (10, 19.55) (11, 19.04) (12, 18.38) (13, 17.58) (14, 16.67) (15, 15.71) (16, 14.71) (17, 13.72) (18, 12.79) (19, 11.94) (20, 11.2z) (21, 10.54) (22, 10.24) (23, 10.03) (24, 10.02) (a) Use both left and right Riemann sums with six subdivisions to estimate the total number of articles (in thousands) in the journal written by researchers in the United States during the 12-year period beginning at the start of 1993. (Estimate each value of r(t) to the nearest 1.25.) left sum 250 thousand articles right sum 242.5 thousand articles (b) Use the answers from part (a) to obtain an estirmate of r(t) dt. 246.25 Interpret the result. Since r(t) is given in thousands articles per year, we conclude that a total of about 246,250 articles in the journal were written by rescarchers in the U.S. in the 12 -year period beginning 1993.
Expert Answer:
Related Book For
Posted Date:
Students also viewed these mathematics questions
-
The rate of change of atmospheric pressure P with respect to altitude is proportional to P, provided that the temperature is constant. At 15oC the pressure is 101.3 kPa at sea level and 87.14 kPa at...
-
The rate of change of atmospheric pressure P with respect to altitude is proportional to P, provided that the temperature is constant. At 15C the pressure is 101.3 kPa at sea level and 87.14 kPa at h...
-
The rate of change of atmospheric temperature with respect to altitude is equal to the slope of the tangent line to a graph. Which graph? What are possible units for this rate?
-
You have the following frequency distribution of the Travel Time to work for residents in South Beach neighborhood. Please answer the questions that follow after the Frequency Table. Travel Time a....
-
Describe two methods for treating the pre-acquisition revenue and expense items of a subsidiary purchased during a fiscal period.
-
For each of the following statements, draw a diagram that illustrates the likely effect on the market for eggs. Indicate in each case the impact on equilibrium price and equilibrium quantity. a. The...
-
Ambassador Watch Company budgeted the following costs for anticipated production for April 2002: Prepare a factory overhead cost budget, separating variable and fixed costs. Assume that all indirect...
-
Moreno Manufacturing Corporation was started with the issuance of common stock for $30,000. It purchased $7,000 of raw materials and worked on three job orders during 2015 for which data follow....
-
2025 Prepare a schedule that shows annual deprecation expense, accumulated depreciation, and book value for 2024 and 2025 using the following methods: a. Straight Line b. Units of Production c....
-
Evaluate the double integral. A(Jw TEdt dw
-
What are the strengths or uniqueness of the company's compensation policy or practice? Does the focal compensation policy or practice help the organization perform better? How? Can you provide...
-
1. Discuss the term structure and interest rate yields on Bonds. 2. Why is that bonds that are exactly the same in every other way except for their length to maturity, why do they have different...
-
Dawson Toys, Ltd., produces a toy called the Maze. The company has recently established a standard cost system to help control costs and has established the following standards for the Maze toy:...
-
Briefly discuss the clear communications of realistic financial data for Starbucks current cold brew and coffee market performances including profit and loss statements over three years and...
-
How can the concept of information density be applied to optimize the conciseness of visual and multimedia presentations, ensuring effective communication while avoiding cognitive overload ?
-
A Name: 24. Both closed and open-end funds have management fees ranging as high as Finance 3830 Problem Set 1 25. Dark pool trades are from the public. 26. A good rule of thumb for the firm's quick...
-
To balance the chemical equation SiH3 + O2 SiO2 + HO, you could introduce coefficients a, b, c, d and write aSiH3 + bO2 cSiO + dHO then write linear equations for each element. The equation for Si...
-
Find the derivative of the function. a. b. F(x)=): el
-
(a) Estimate the value of by graphing the function f(x) = x2 + x + 1 + x. (b) Use a table of values of f(x) to guess the value of the limit. (c) Prove that your guess is correct. lim Vxx1+
-
A graph of the temperature in New York City on September 19, 2009 is shown. Use Simpson's Rule with n = 12 to estimate the average temperature on that day. Tf (F) 70- 60- 50- 4. noon 4.
-
Presented below are summary financial data from the Johnson & Johnson 2015 annual report. Using the ratio definitions from Exhibit 4.6, calculate the following ratios: return on equity, return on...
-
Presented below are summary financial data from the Bristol-Myers Squibb 2015 annual report. Using the ratio definitions from Exhibit 4.6, calculate the following liquidity and solvency ratios: cash...
-
Presented below are summary financial data from The Boeing Company 2015 annual report. Using the ratio definitions from Exhibit 4.6, calculate the following ratios: return on equity, return on assets...
Study smarter with the SolutionInn App