

The research paper assignment is worth 240 points or 24% of the course grade. A grade...
Fantastic news! We've Found the answer you've been seeking!
Question:
Transcribed Image Text:
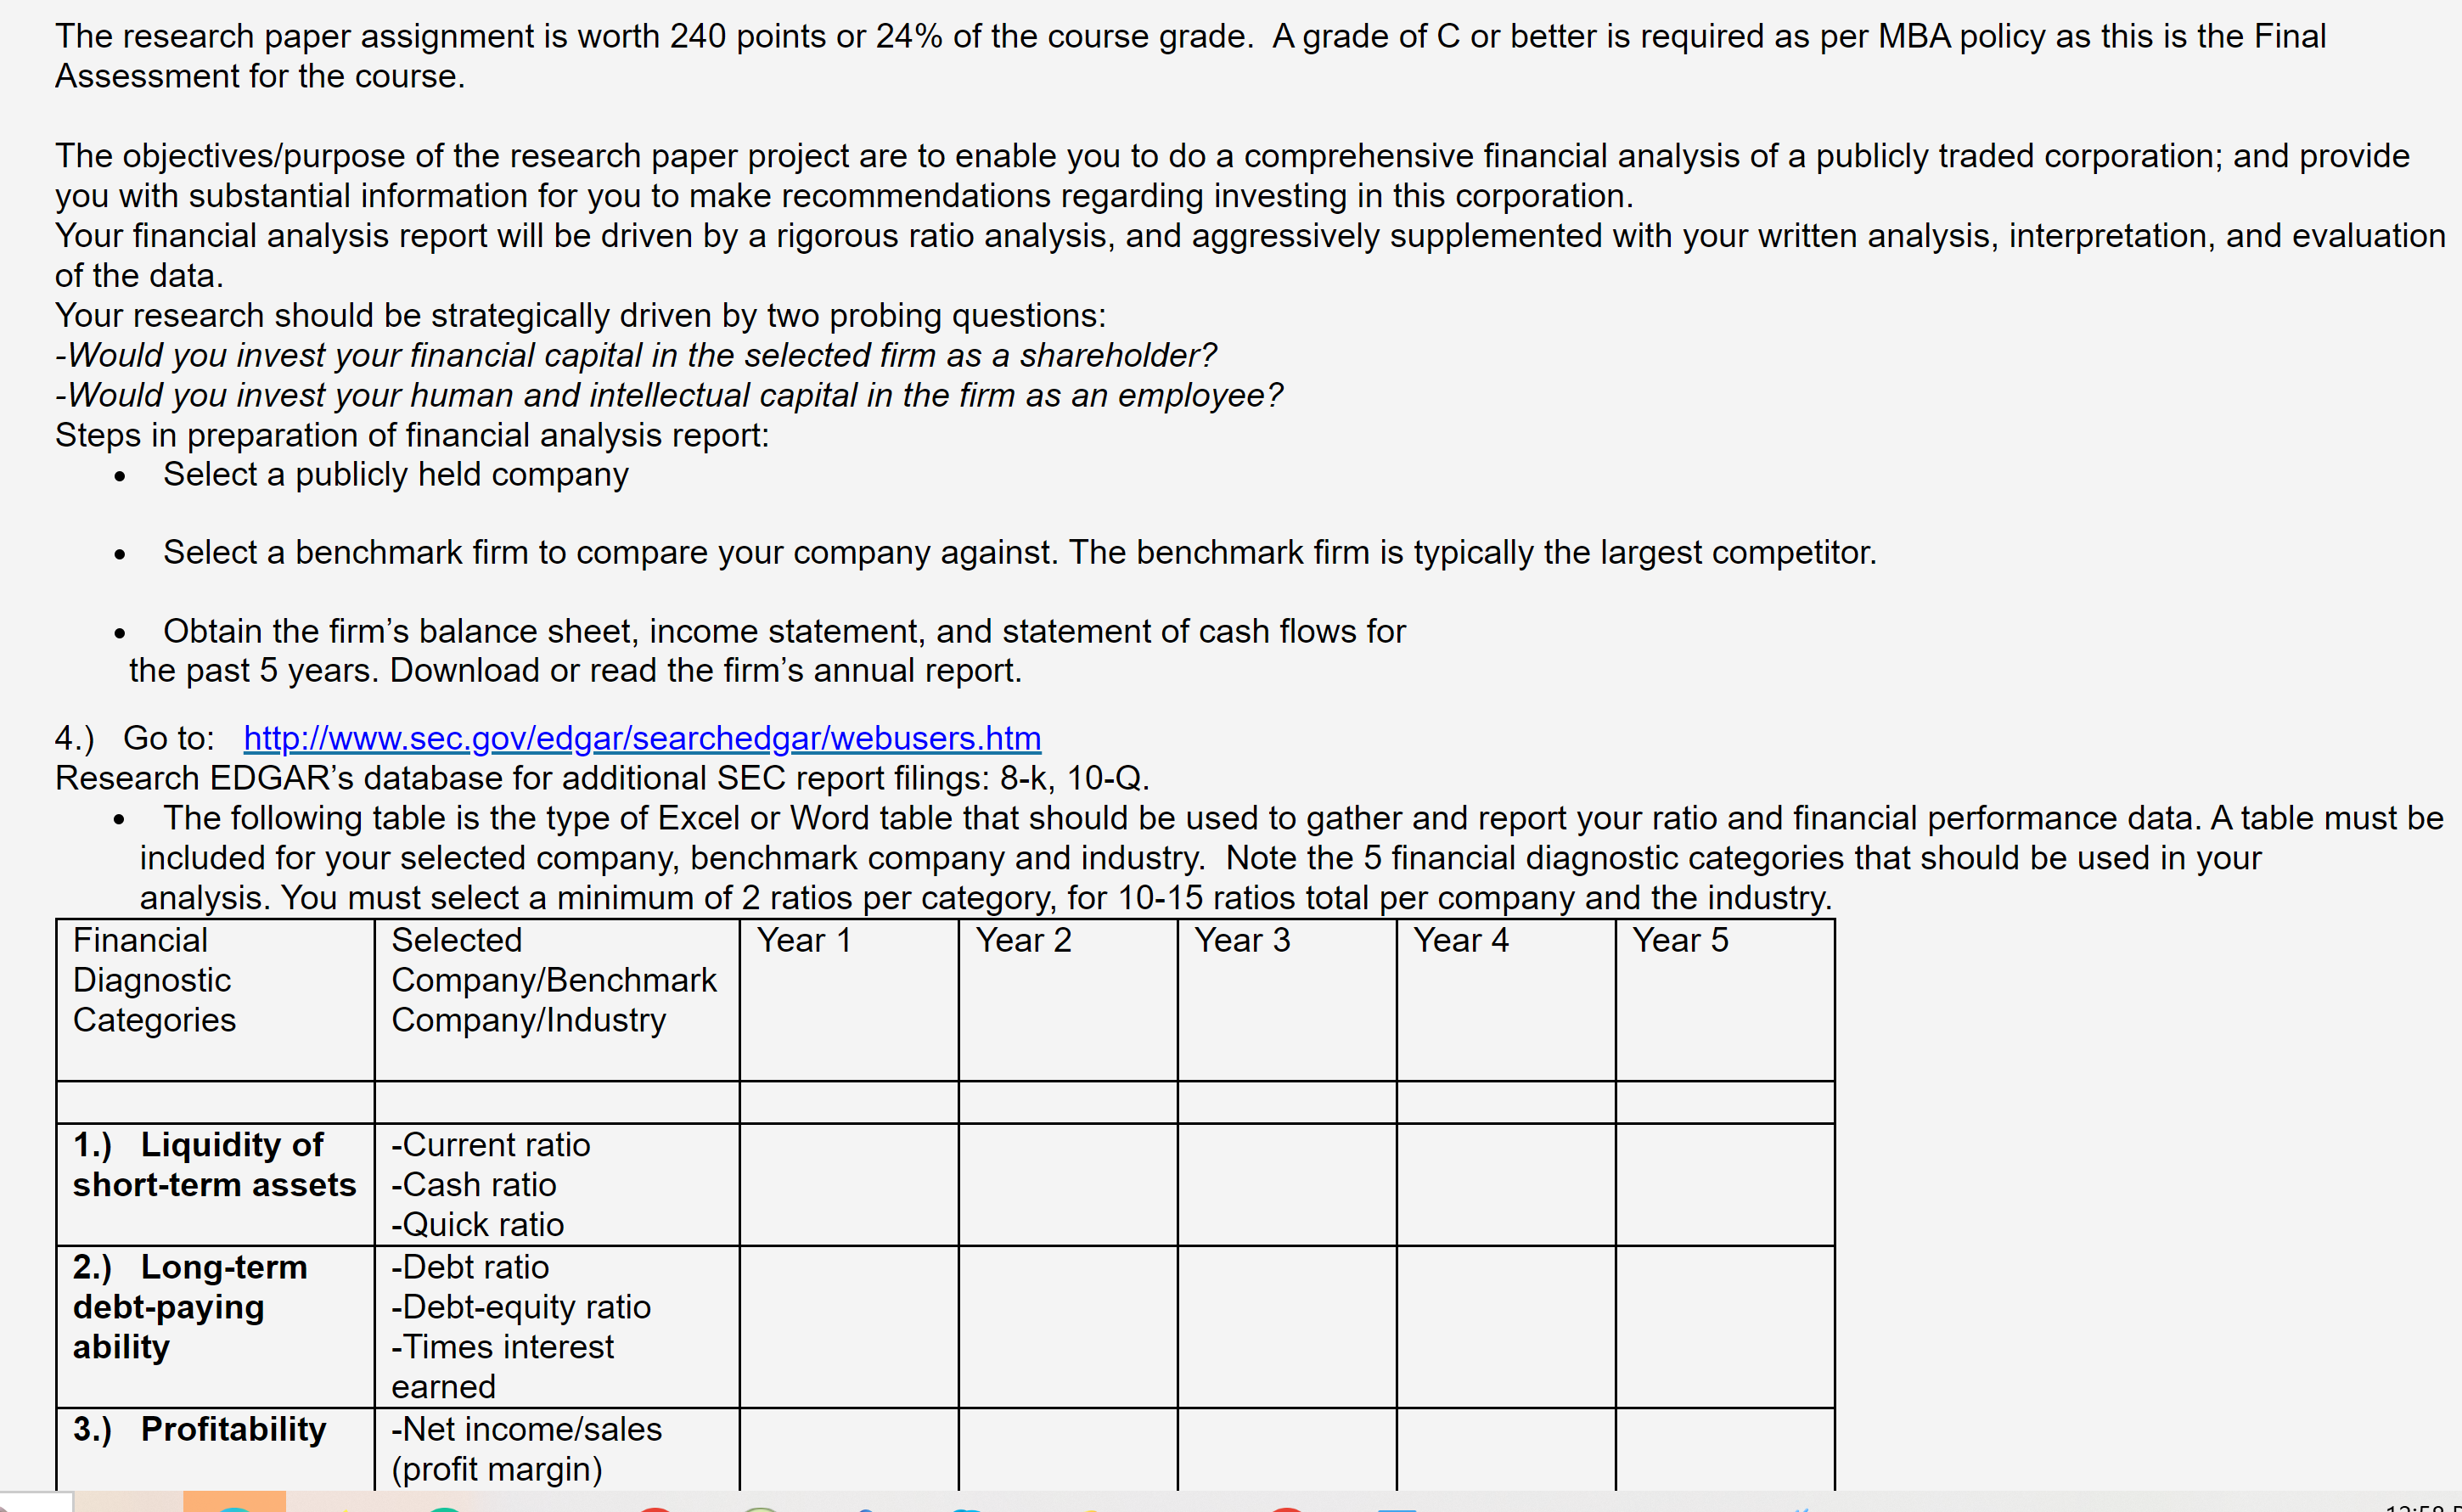
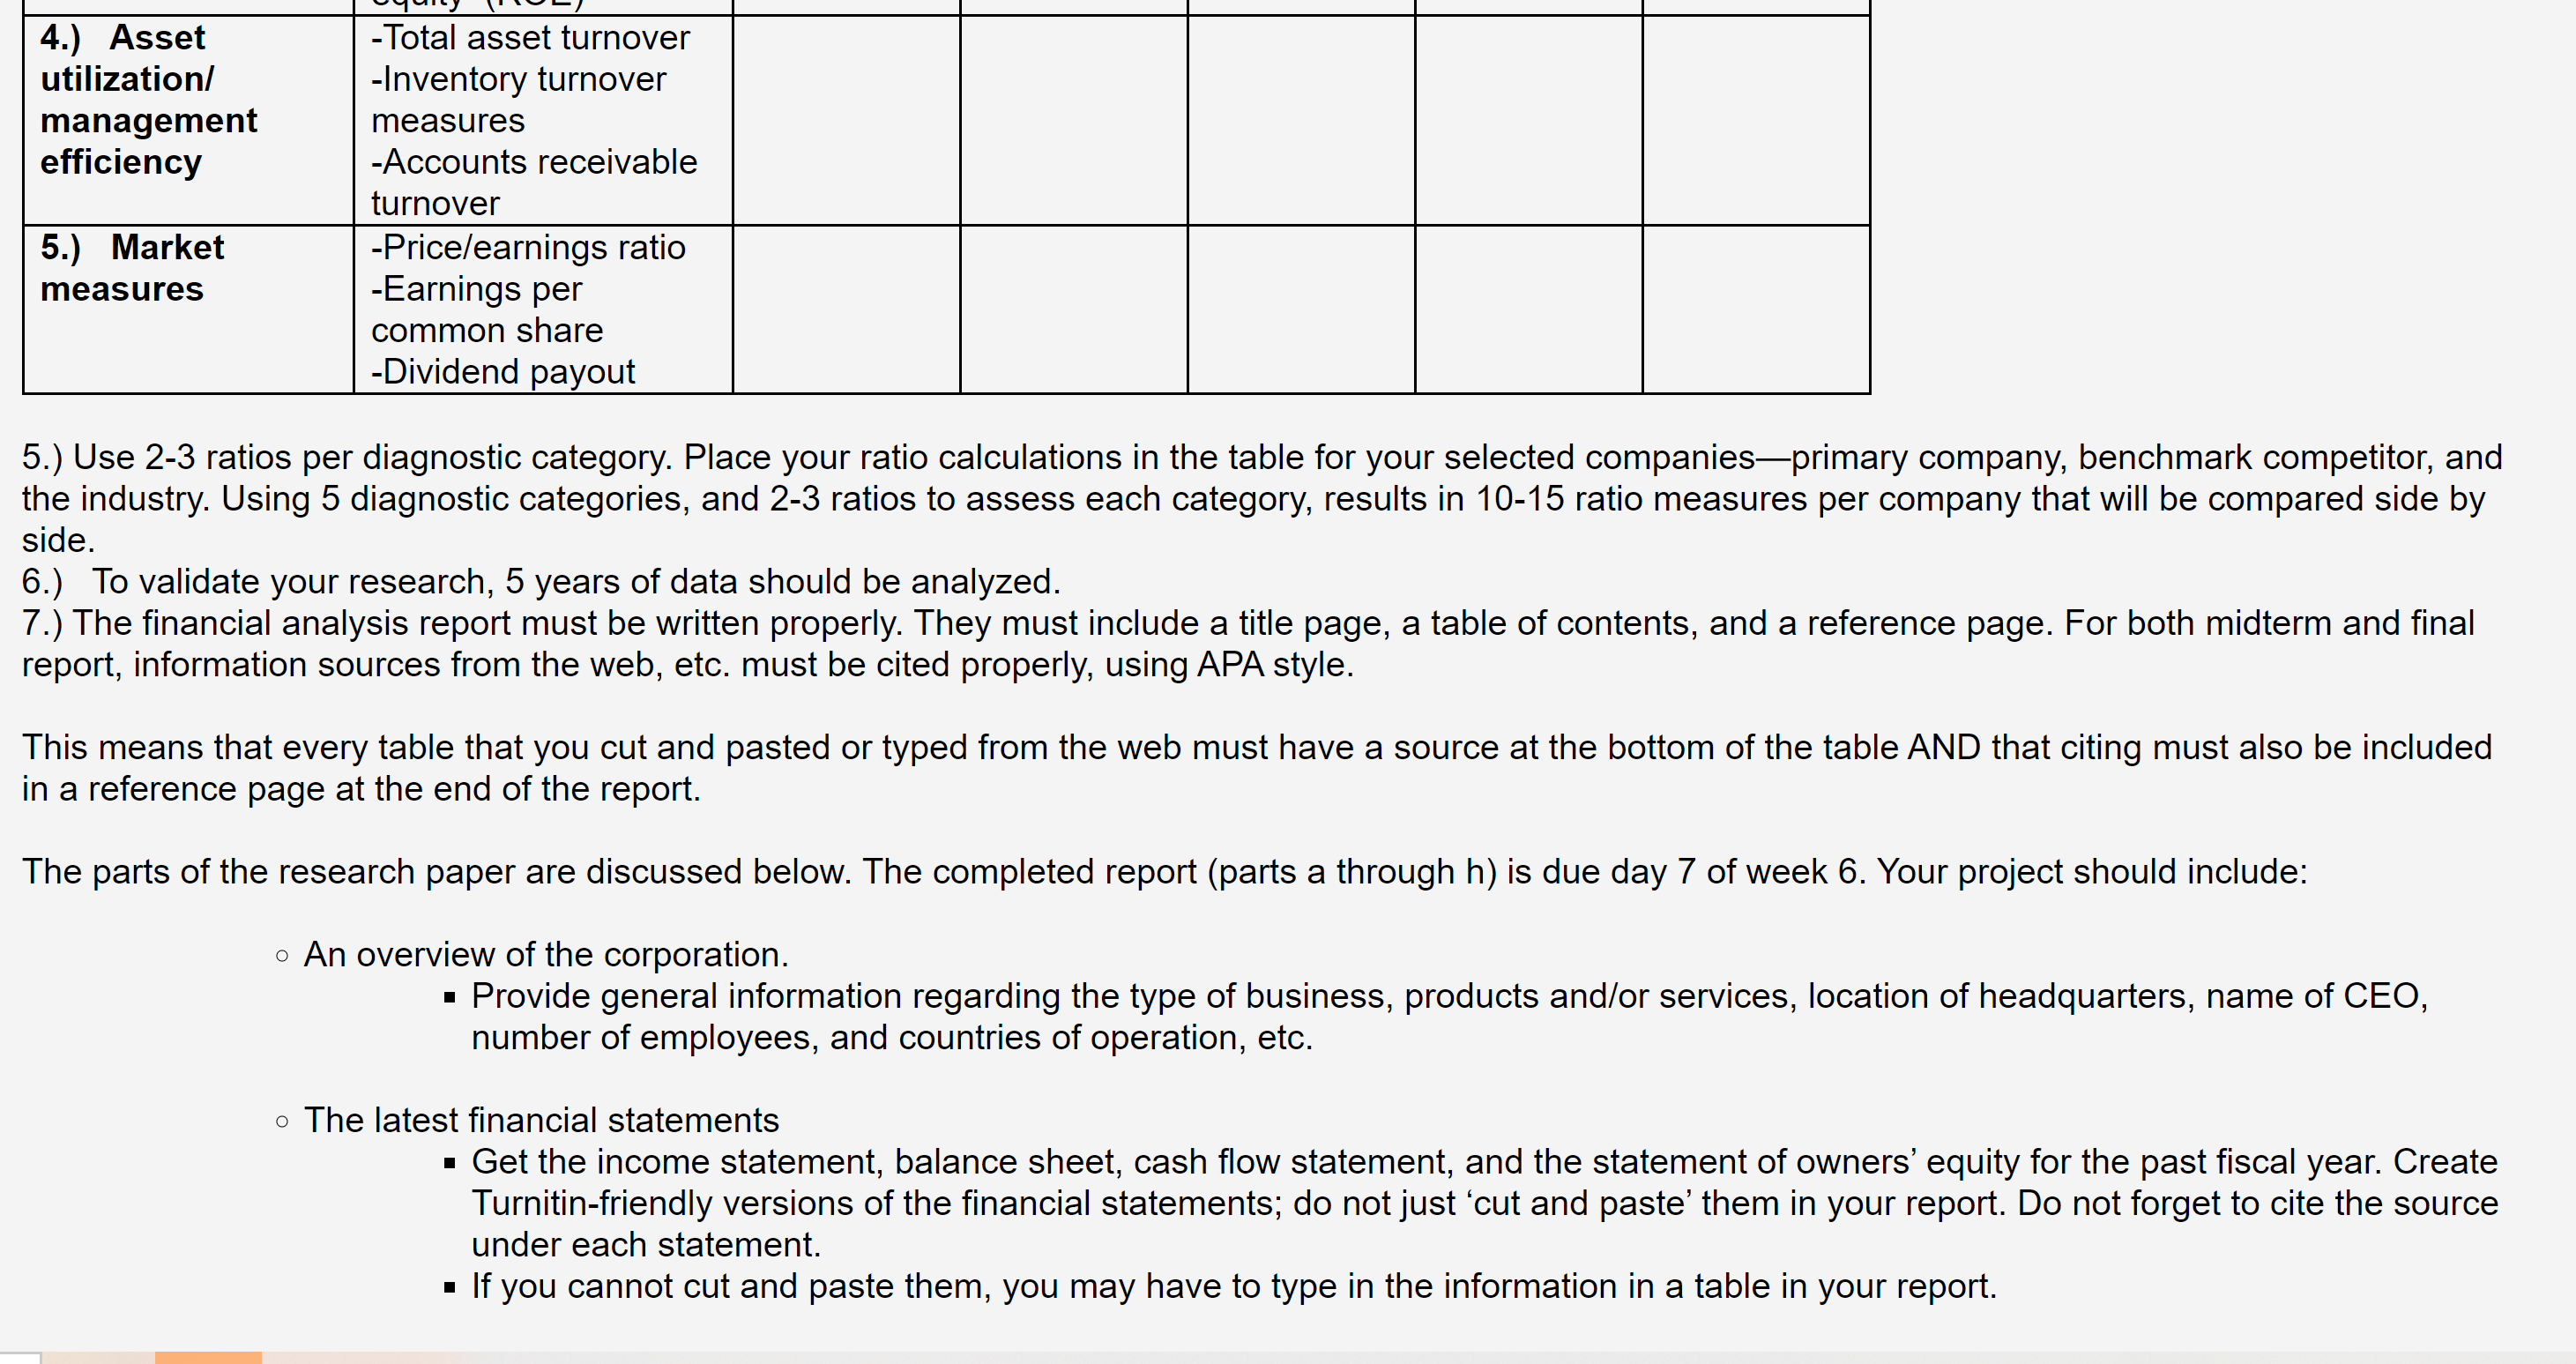
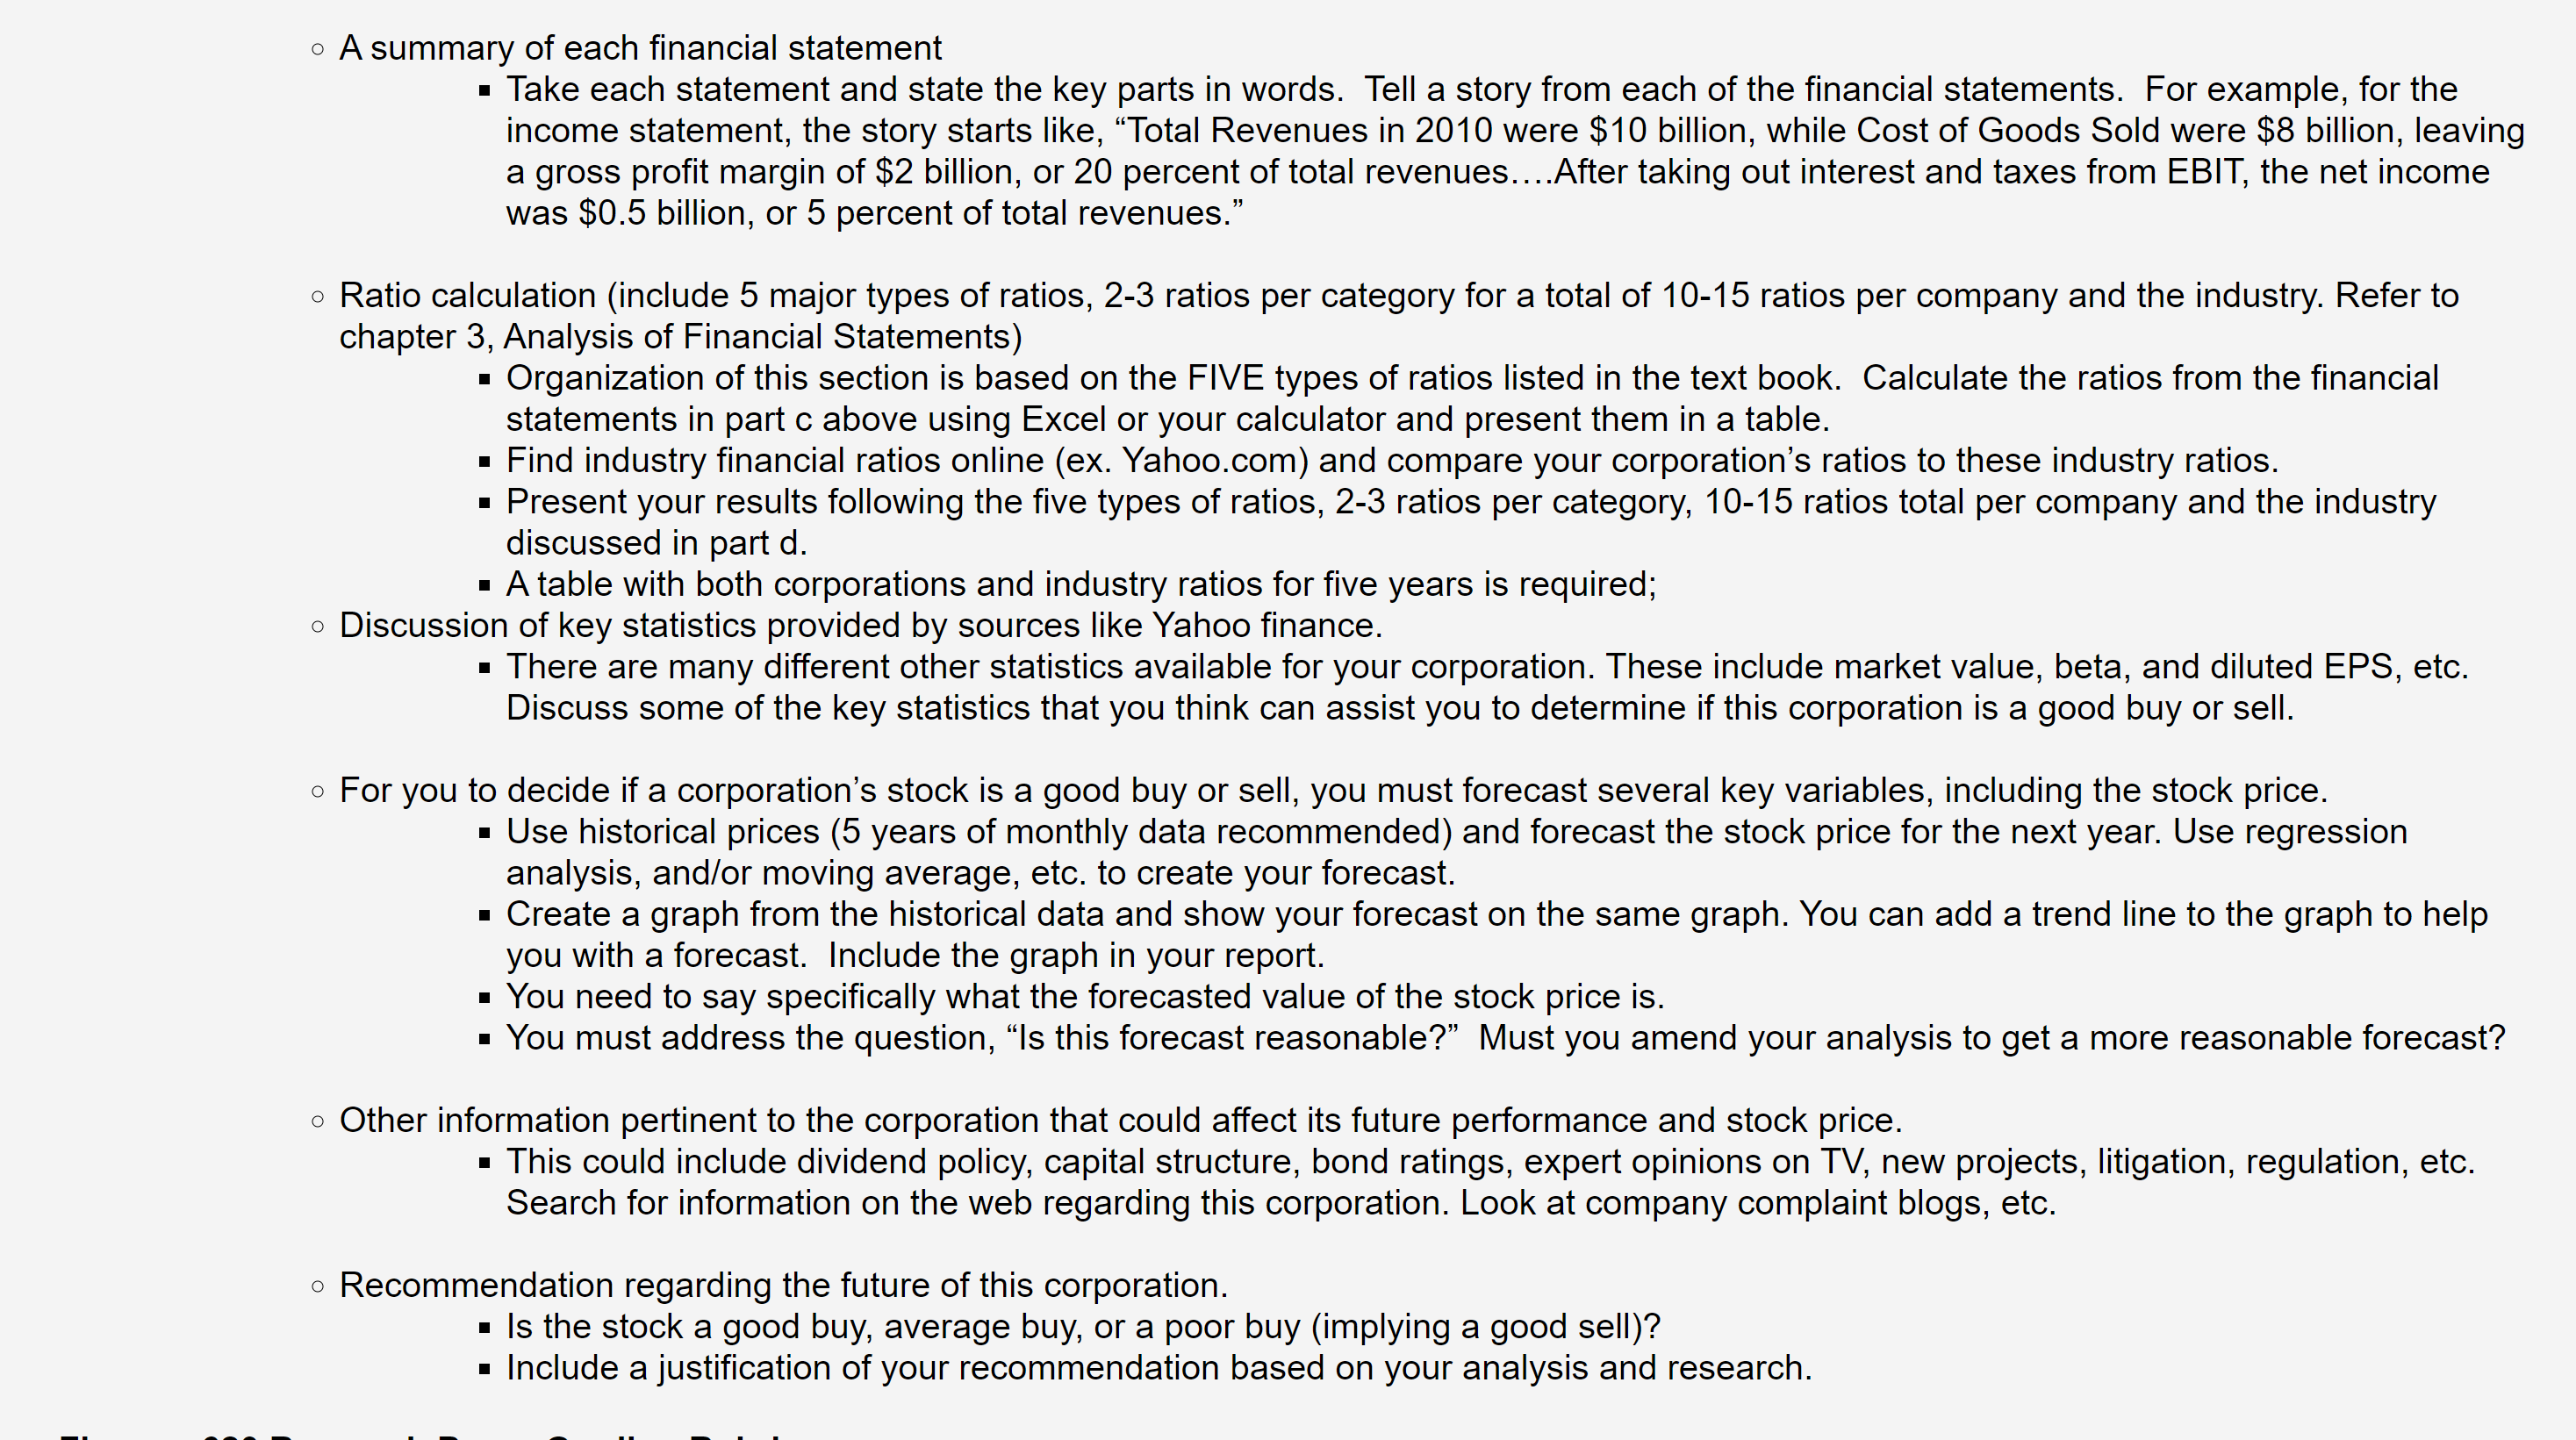
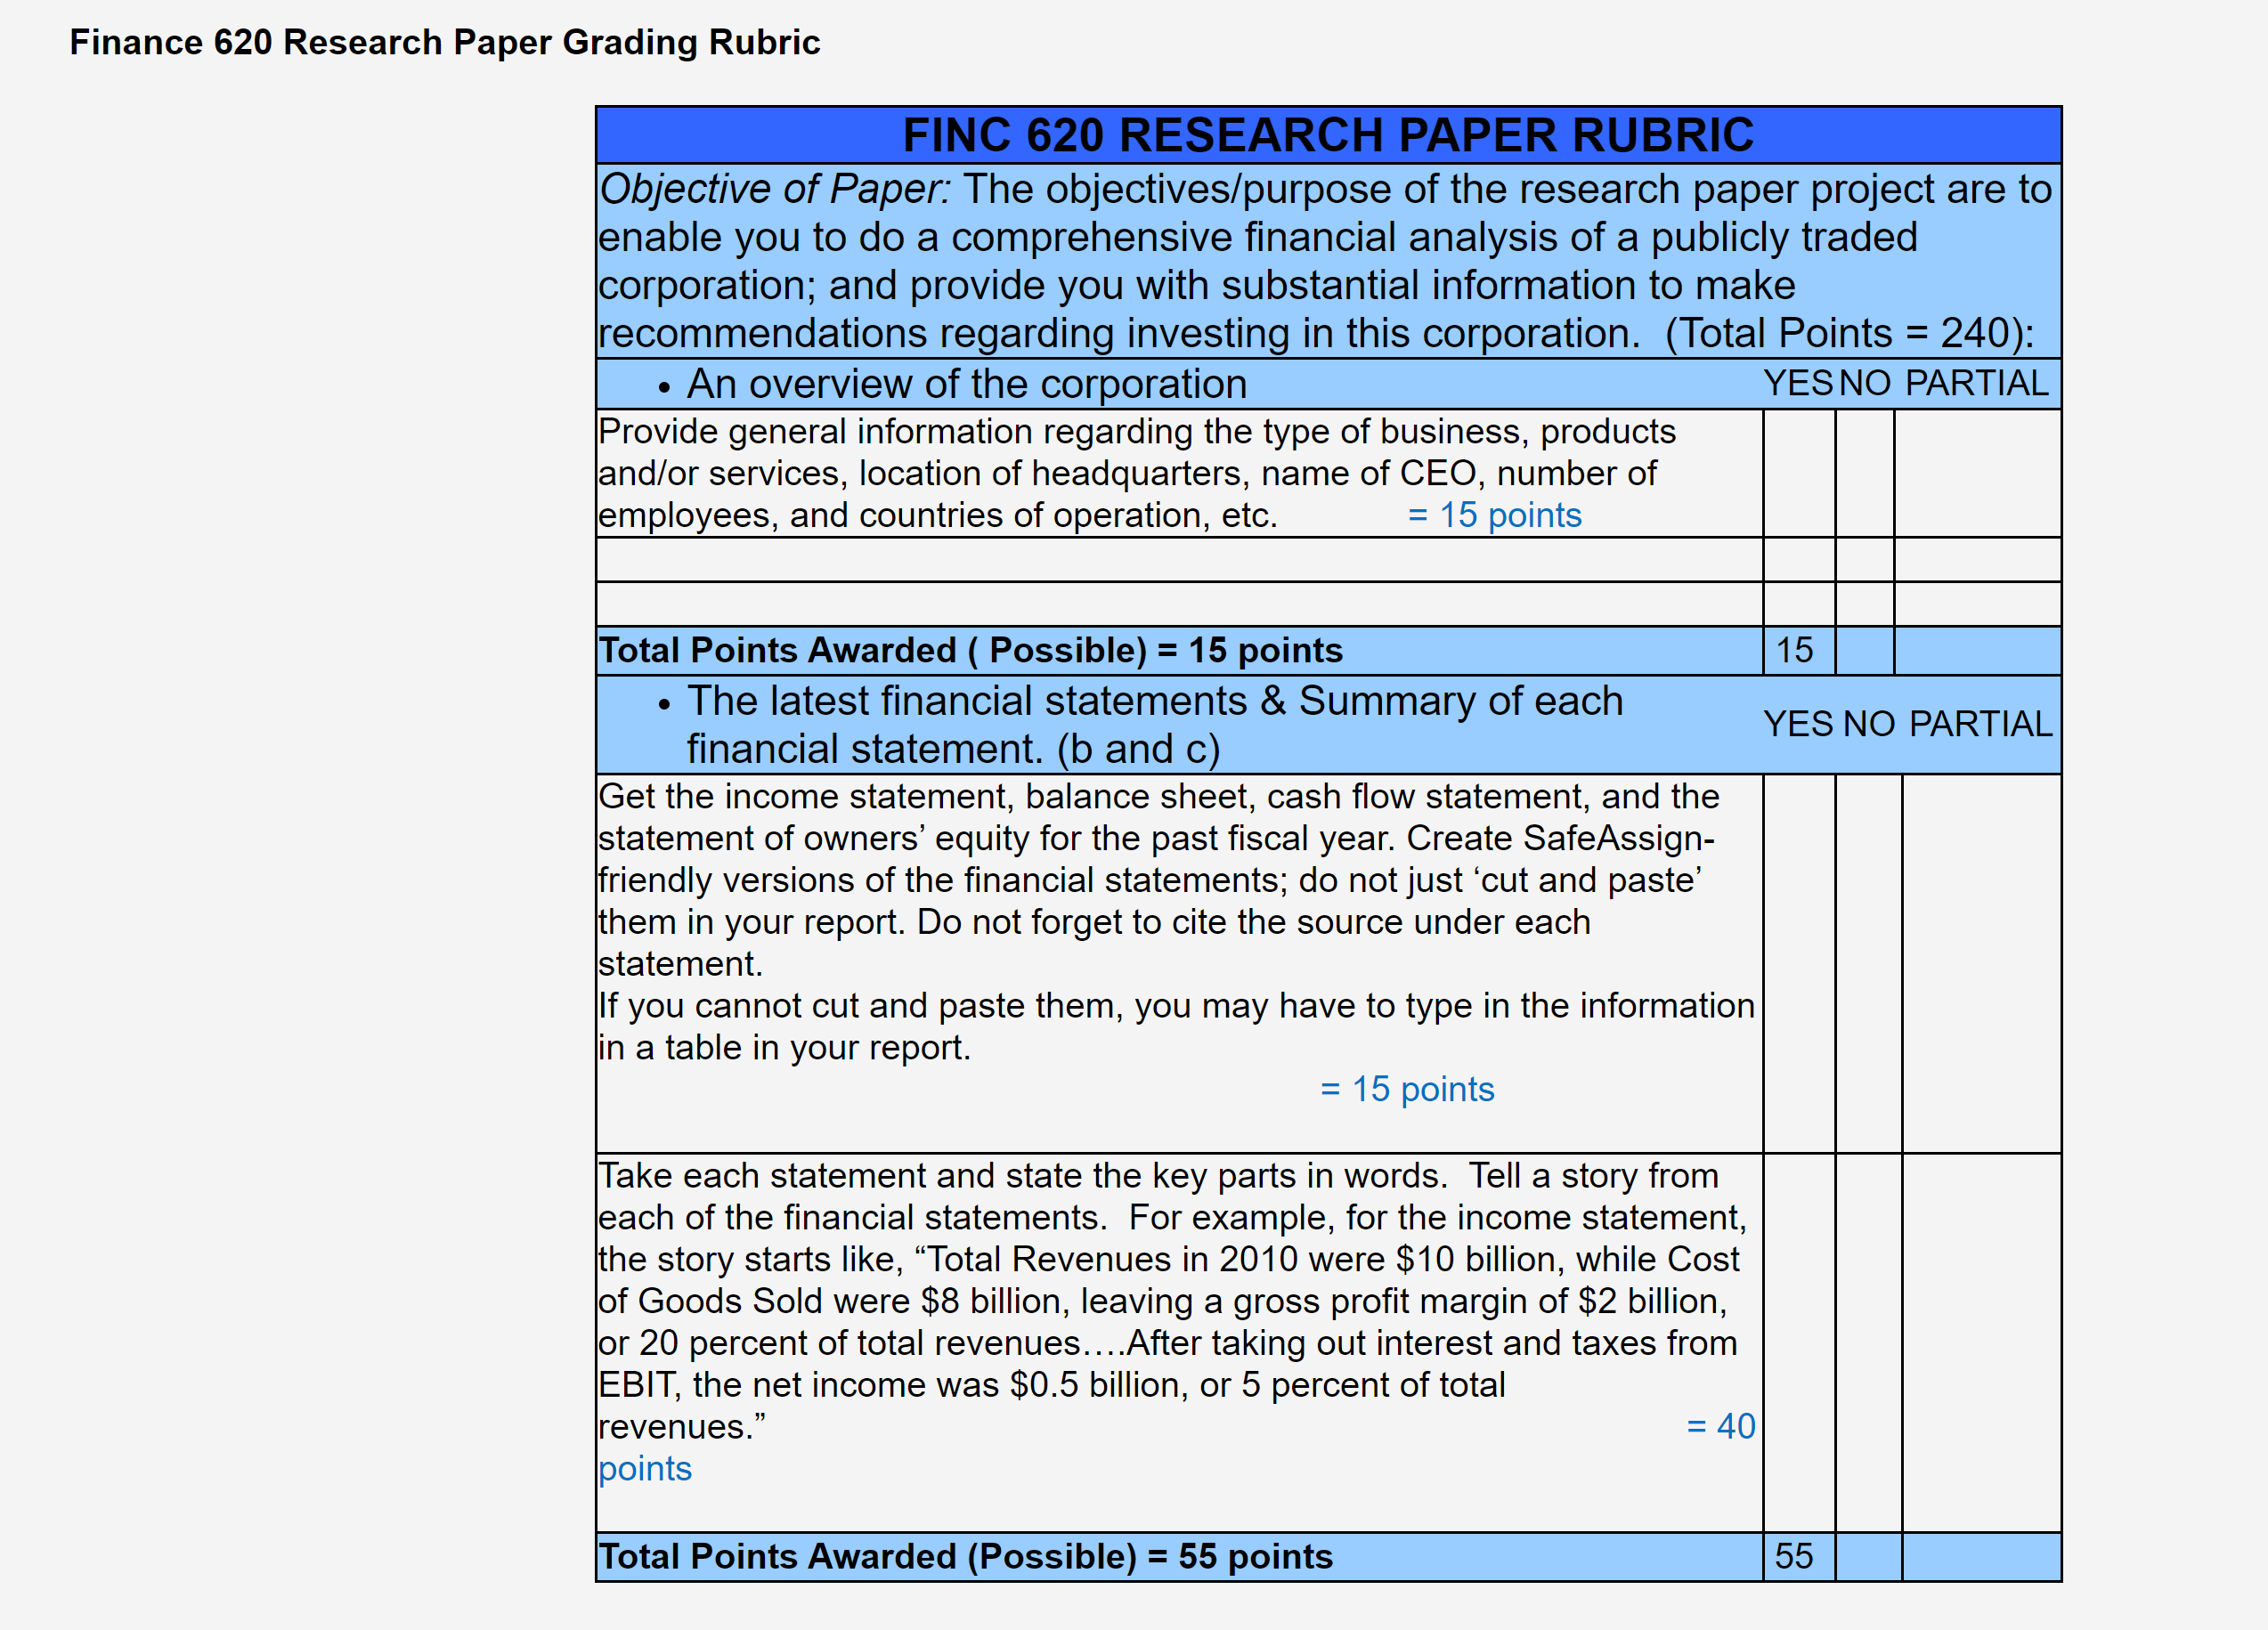
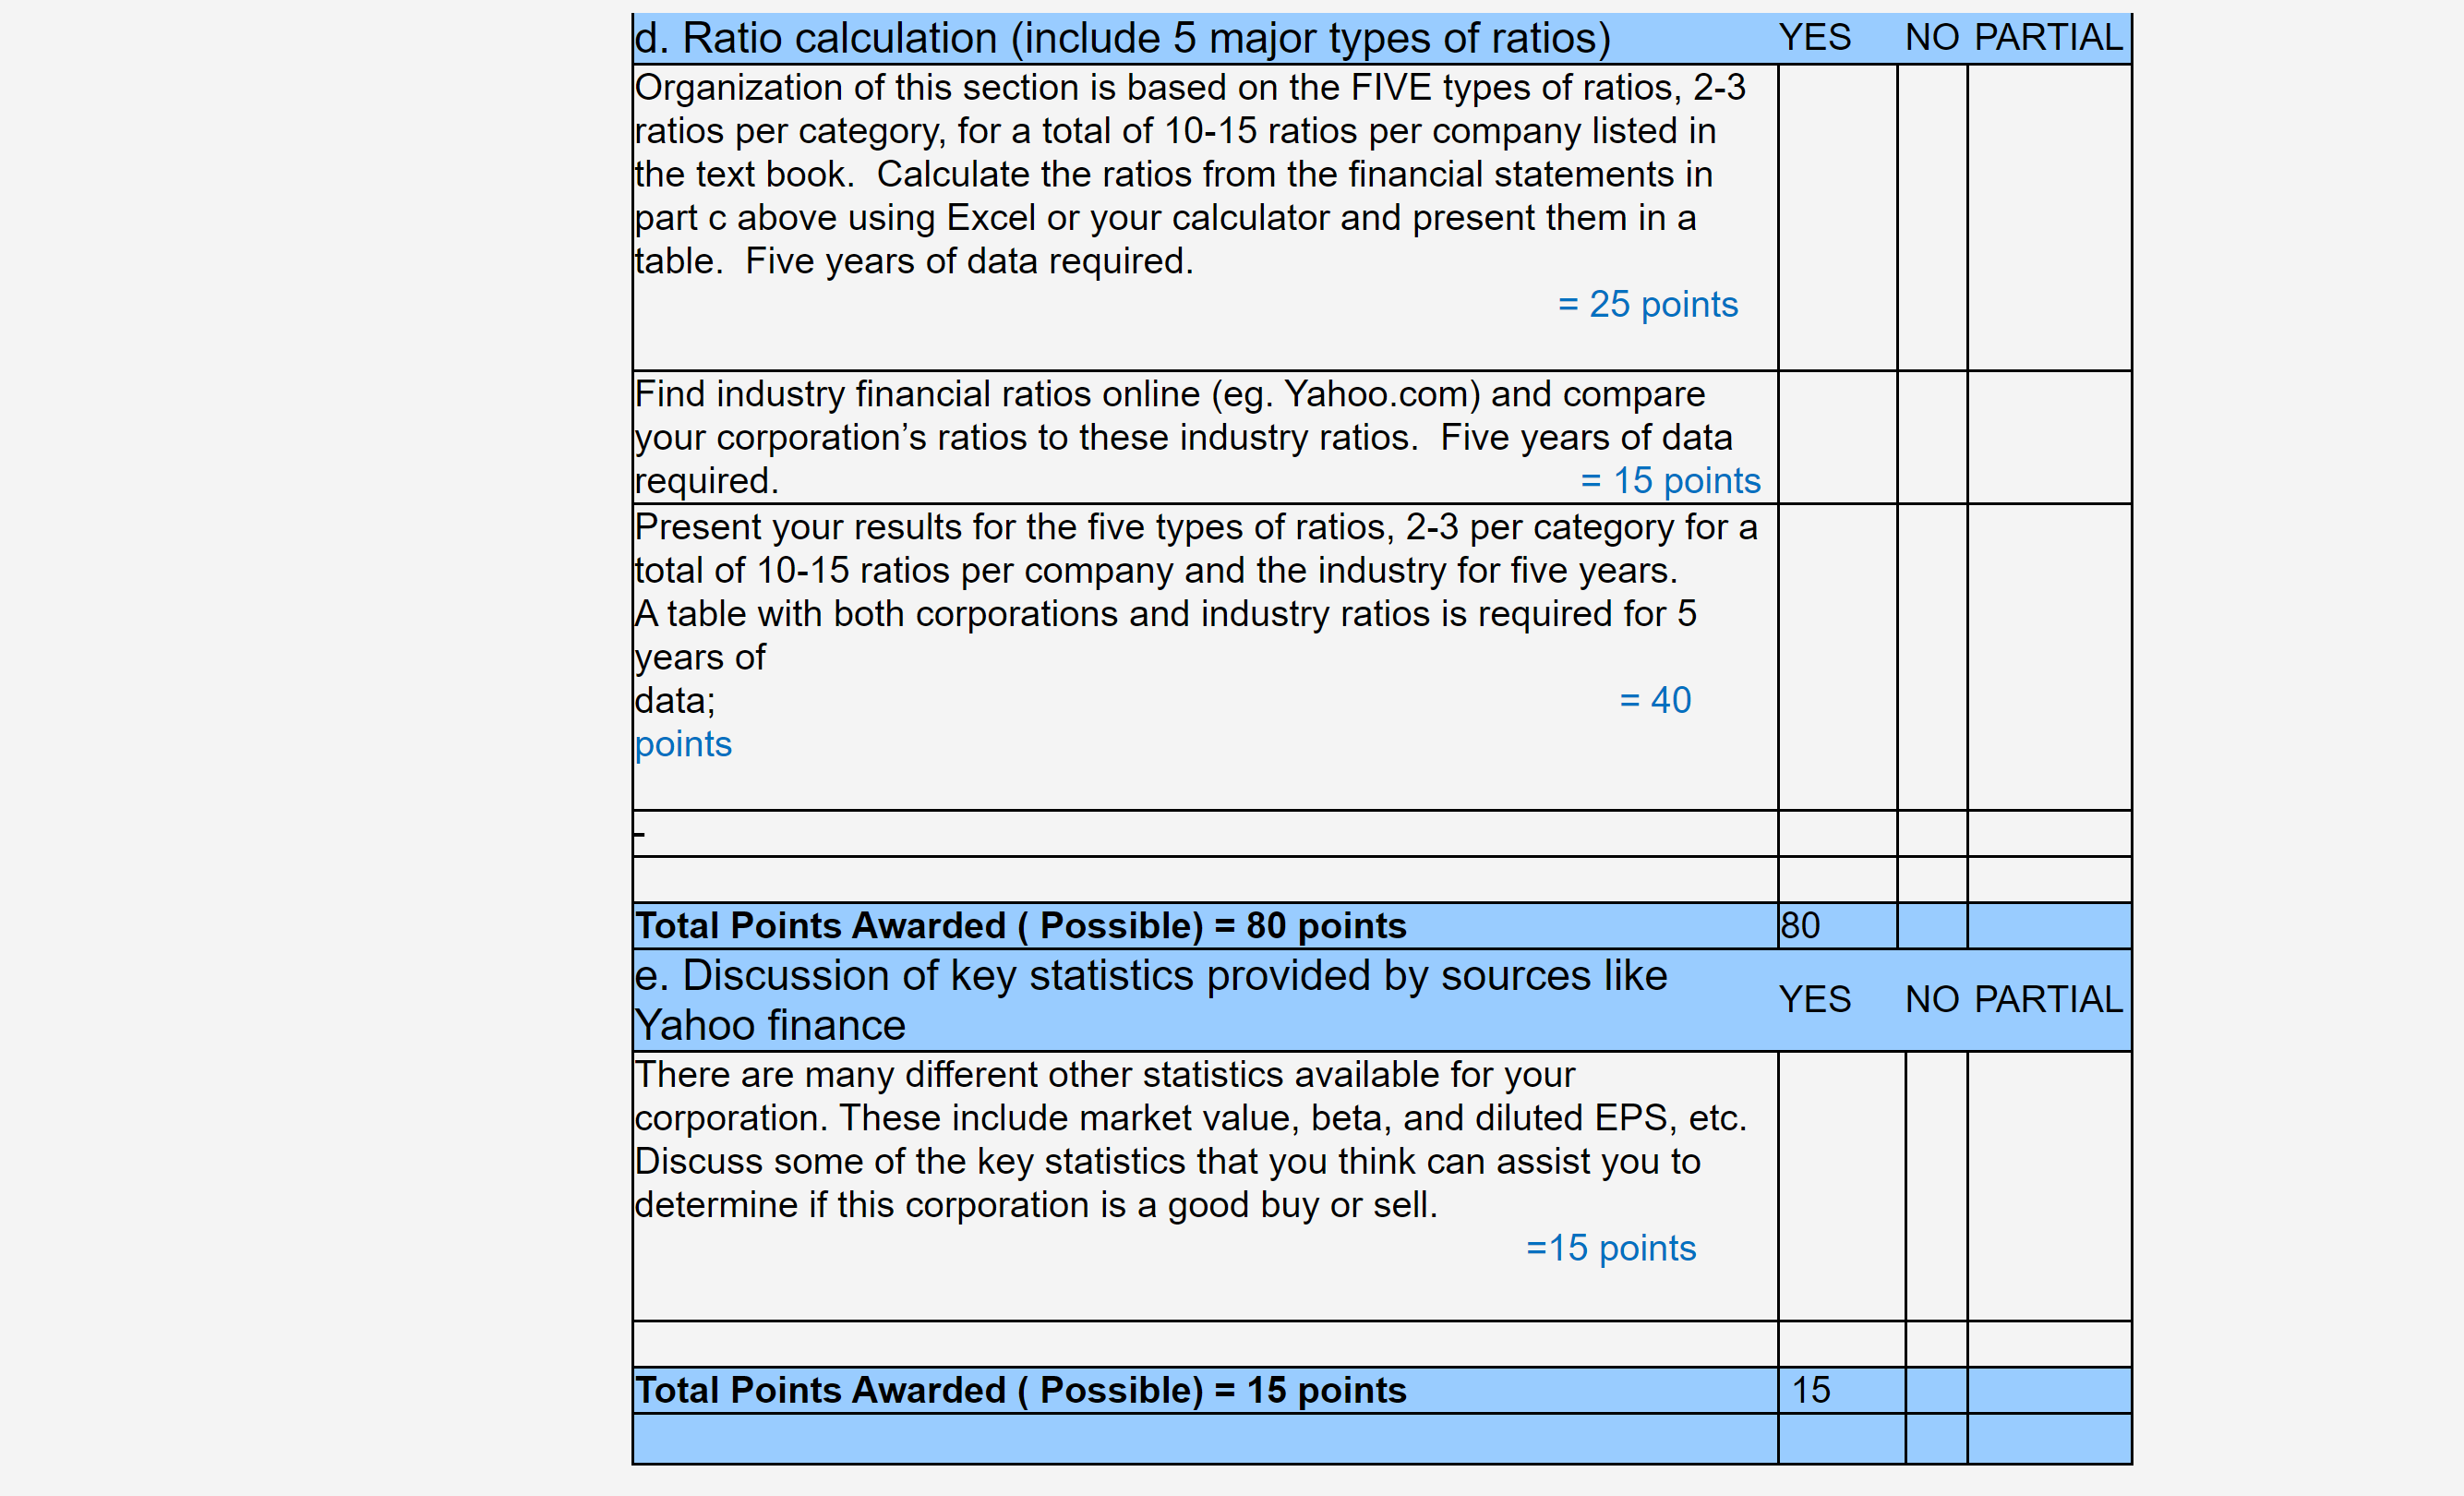
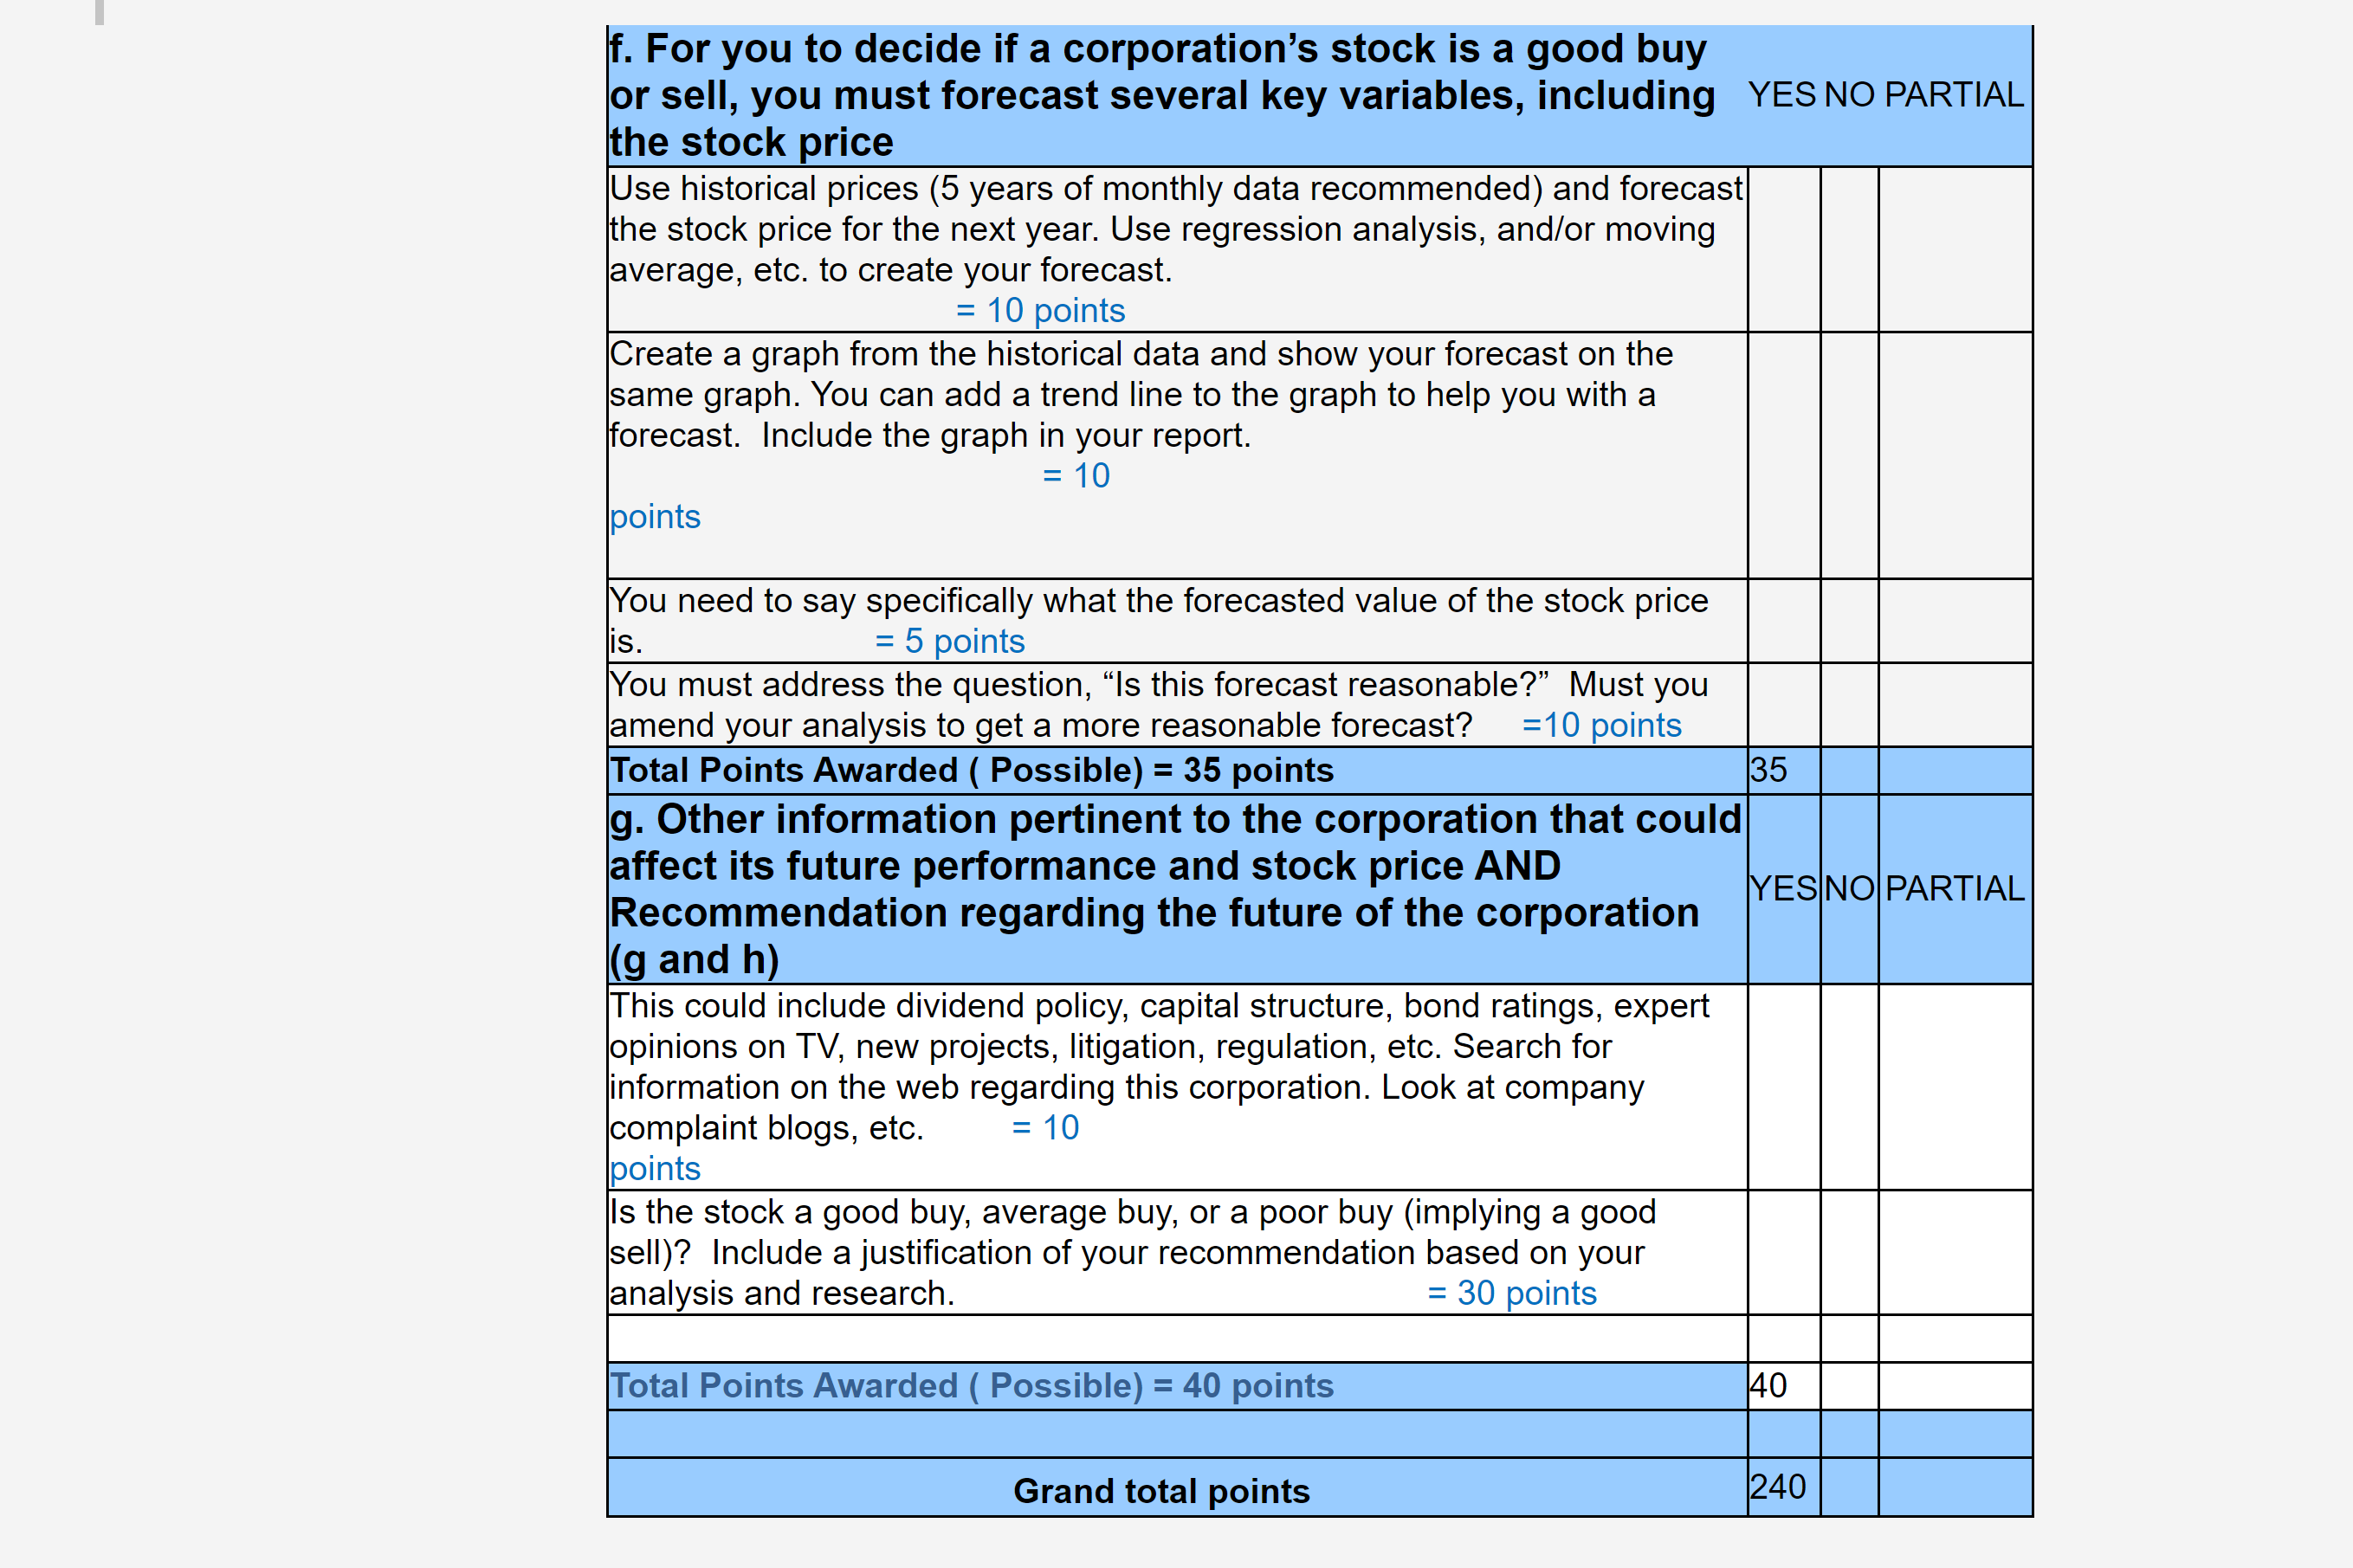
The research paper assignment is worth 240 points or 24% of the course grade. A grade of C or better is required as per MBA policy as this is the Final Assessment for the course. The objectives/purpose of the research paper project are to enable you to do a comprehensive financial analysis of a publicly traded corporation; and provide you with substantial information for you to make recommendations regarding investing in this corporation. Your financial analysis report will be driven by a rigorous ratio analysis, and aggressively supplemented with your written analysis, interpretation, and evaluation of the data. Your research should be strategically driven by two probing questions: -Would you invest your financial capital in the selected firm as a shareholder? -Would you invest your human and intellectual capital in the firm as an employee? Steps in preparation of financial analysis report: • Select a publicly held company Select a benchmark firm to compare your company against. The benchmark firm is typically the largest competitor. Obtain the firm's balance sheet, income statement, and statement of cash flows for the past 5 years. Download or read the firm's annual report. 4.) Go to: http://www.sec.gov/edgar/searchedgar/webusers.htm Research EDGAR's database for additional SEC report filings: 8-k, 10-Q. • The following table is the type of Excel or Word table that should be used to gather and report your ratio and financial performance data. A table must be included for your selected company, benchmark company and industry. Note the 5 financial diagnostic categories that should be used in your analysis. You must select a minimum of 2 ratios per category, for 10-15 ratios total per company and the industry. Financial Diagnostic Categories Selected Company/Benchmark Company/Industry 1.) Liquidity of -Current ratio -Cash ratio -Quick ratio short-term assets 2.) Long-term debt-paying ability 3.) Profitability -Debt ratio -Debt-equity ratio -Times interest earned -Net income/sales (profit margin) Year 1 Year 2 Year 3 Year 4 Year 5 10.505 4.) Asset utilization/ management efficiency 5.) Market measures -Total asset turnover -Inventory turnover measures -Accounts receivable turnover -Price/earnings ratio -Earnings per common share -Dividend payout 5.) Use 2-3 ratios per diagnostic category. Place your ratio calculations in the table for your selected companies-primary company, benchmark competitor, and the industry. Using 5 diagnostic categories, and 2-3 ratios to assess each category, results in 10-15 ratio measures per company that will be compared side by side. 6.) To validate your research, 5 years of data should be analyzed. 7.) The financial analysis report must be written properly. They must include a title page, a table of contents, and a reference page. For both midterm and final report, information sources from the web, etc. must be cited properly, using APA style. This means that every table that you cut and pasted or typed from the web must have a source at the bottom of the table AND that citing must also be included in a reference page at the end of the report. The parts of the research paper are discussed below. The completed report (parts a through h) is due day 7 of week 6. Your project should include: • An overview of the corporation. ■ Provide general information regarding the type of business, products and/or services, location of headquarters, name of CEO, number of employees, and countries of operation, etc. • The latest financial statements ■ Get the income statement, balance sheet, cash flow statement, and the statement of owners' equity for the past fiscal year. Create Turnitin-friendly versions of the financial statements; do not just 'cut and paste' them in your report. Do not forget to cite the source under each statement. If you cannot cut and paste them, you may have to type in the information in a table in your report. 。 A summary of each financial statement ■ Take each statement and state the key parts in words. Tell a story from each of the financial statements. For example, for the income statement, the story starts like, “Total Revenues in 2010 were $10 billion, while Cost of Goods Sold were $8 billion, leaving a gross profit margin of $2 billion, or 20 percent of total revenues....After taking out interest and taxes from EBIT, the net income was $0.5 billion, or 5 percent of total revenues." 。 Ratio calculation (include 5 major types of ratios, 2-3 ratios per category for a total of 10-15 ratios per company and the industry. Refer to chapter 3, Analysis of Financial Statements) Organization of this section is based on the FIVE types of ratios listed in the text book. Calculate the ratios from the financial statements in part c above using Excel or your calculator and present them in a table. ■ Find industry financial ratios online (ex. Yahoo.com) and compare your corporation's ratios to these industry ratios. ■ Present your results following the five types of ratios, 2-3 ratios per category, 10-15 ratios total per company and the industry discussed in part d. ■ A table with both corporations and industry ratios for five years is required; ⚫ Discussion of key statistics provided by sources like Yahoo finance. There are many different other statistics available for your corporation. These include market value, beta, and diluted EPS, etc. Discuss some of the key statistics that you think can assist you to determine if this corporation is a good buy or sell. ⚫ For you to decide if a corporation's stock is a good buy or sell, you must forecast several key variables, including the stock price. ■ Use historical prices (5 years of monthly data recommended) and forecast the stock price for the next year. Use regression analysis, and/or moving average, etc. to create your forecast. ■ Create a graph from the historical data and show your forecast on the same graph. You can add a trend line to the graph to help you with a forecast. Include the graph in your report. ■ You need to say specifically what the forecasted value of the stock price is. ■ You must address the question, "Is this forecast reasonable?” Must you amend your analysis to get a more reasonable forecast? ⚫ Other information pertinent to the corporation that could affect its future performance and stock price. ■ This could include dividend policy, capital structure, bond ratings, expert opinions on TV, new projects, litigation, regulation, etc. Search for information on the web regarding this corporation. Look at company complaint blogs, etc. • Recommendation regarding the future of this corporation. ■ Is the stock a good buy, average buy, or a poor buy (implying a good sell)? ■ Include a justification of your recommendation based on your analysis and research. Finance 620 Research Paper Grading Rubric FINC 620 RESEARCH PAPER RUBRIC Objective of Paper: The objectives/purpose of the research paper project are to enable you to do a comprehensive financial analysis of a publicly traded corporation; and provide you with substantial information to make recommendations regarding investing in this corporation. (Total Points = 240): • An overview of the corporation Provide general information regarding the type of business, products and/or services, location of headquarters, name of CEO, number of employees, and countries of operation, etc. = 15 points YES NO PARTIAL Total Points Awarded (Possible) = 15 points The latest financial statements & Summary of each financial statement. (b and c) Get the income statement, balance sheet, cash flow statement, and the statement of owners' equity for the past fiscal year. Create SafeAssign- friendly versions of the financial statements; do not just 'cut and paste' them in your report. Do not forget to cite the source under each statement. If you cannot cut and paste them, you may have to type in the information in a table in your report. = 15 points Take each statement and state the key parts in words. Tell a story from each of the financial statements. For example, for the income statement, the story starts like, "Total Revenues in 2010 were $10 billion, while Cost of Goods Sold were $8 billion, leaving a gross profit margin of $2 billion, or 20 percent of total revenues....After taking out interest and taxes from EBIT, the net income was $0.5 billion, or 5 percent of total revenues." points Total Points Awarded (Possible) = 55 points = 40 15 YES NO PARTIAL 55 d. Ratio calculation (include 5 major types of ratios) Organization of this section is based on the FIVE types of ratios, 2-3 ratios per category, for a total of 10-15 ratios per company listed in the text book. Calculate the ratios from the financial statements in part c above using Excel or your calculator and present them in a table. Five years of data required. = 25 points Find industry financial ratios online (eg. Yahoo.com) and compare your corporation's ratios to these industry ratios. Five years of data required. = 15 points Present your results for the five types of ratios, 2-3 per category for a total of 10-15 ratios per company and the industry for five years. A table with both corporations and industry ratios is required for 5 years of data; points = 40 YES NO PARTIAL Total Points Awarded (Possible) = 80 points 80 e. Discussion of key statistics provided by sources like Yahoo finance YES NO PARTIAL There are many different other statistics available for your corporation. These include market value, beta, and diluted EPS, etc. Discuss some of the key statistics that you think can assist you to determine if this corporation is a good buy or sell. =15 points Total Points Awarded ( Possible) = 15 points 15 f. For you to decide if a corporation's stock is a good buy or sell, you must forecast several key variables, including YES NO PARTIAL the stock price Use historical prices (5 years of monthly data recommended) and forecast the stock price for the next year. Use regression analysis, and/or moving average, etc. to create your forecast. = 10 points Create a graph from the historical data and show your forecast on the same graph. You can add a trend line to the graph to help you with a forecast. Include the graph in your report. points = 10 You need to say specifically what the forecasted value of the stock price lis. = 5 points You must address the question, "Is this forecast reasonable?" Must you amend your analysis to get a more reasonable forecast? =10 points Total Points Awarded ( Possible) = 35 points g. Other information pertinent to the corporation that could affect its future performance and stock price AND Recommendation regarding the future of the corporation (g and h) This could include dividend policy, capital structure, bond ratings, expert opinions on TV, new projects, litigation, regulation, etc. Search for information on the web regarding this corporation. Look at company complaint blogs, etc. = 10 points Is the stock a good buy, average buy, or a poor buy (implying a good sell)? Include a justification of your recommendation based on your analysis and research. = 30 points Total Points Awarded ( Possible) = 40 points 35 YES NO PARTIAL 40 Grand total points 240 The research paper assignment is worth 240 points or 24% of the course grade. A grade of C or better is required as per MBA policy as this is the Final Assessment for the course. The objectives/purpose of the research paper project are to enable you to do a comprehensive financial analysis of a publicly traded corporation; and provide you with substantial information for you to make recommendations regarding investing in this corporation. Your financial analysis report will be driven by a rigorous ratio analysis, and aggressively supplemented with your written analysis, interpretation, and evaluation of the data. Your research should be strategically driven by two probing questions: -Would you invest your financial capital in the selected firm as a shareholder? -Would you invest your human and intellectual capital in the firm as an employee? Steps in preparation of financial analysis report: • Select a publicly held company Select a benchmark firm to compare your company against. The benchmark firm is typically the largest competitor. Obtain the firm's balance sheet, income statement, and statement of cash flows for the past 5 years. Download or read the firm's annual report. 4.) Go to: http://www.sec.gov/edgar/searchedgar/webusers.htm Research EDGAR's database for additional SEC report filings: 8-k, 10-Q. • The following table is the type of Excel or Word table that should be used to gather and report your ratio and financial performance data. A table must be included for your selected company, benchmark company and industry. Note the 5 financial diagnostic categories that should be used in your analysis. You must select a minimum of 2 ratios per category, for 10-15 ratios total per company and the industry. Financial Diagnostic Categories Selected Company/Benchmark Company/Industry 1.) Liquidity of -Current ratio -Cash ratio -Quick ratio short-term assets 2.) Long-term debt-paying ability 3.) Profitability -Debt ratio -Debt-equity ratio -Times interest earned -Net income/sales (profit margin) Year 1 Year 2 Year 3 Year 4 Year 5 10.505 4.) Asset utilization/ management efficiency 5.) Market measures -Total asset turnover -Inventory turnover measures -Accounts receivable turnover -Price/earnings ratio -Earnings per common share -Dividend payout 5.) Use 2-3 ratios per diagnostic category. Place your ratio calculations in the table for your selected companies-primary company, benchmark competitor, and the industry. Using 5 diagnostic categories, and 2-3 ratios to assess each category, results in 10-15 ratio measures per company that will be compared side by side. 6.) To validate your research, 5 years of data should be analyzed. 7.) The financial analysis report must be written properly. They must include a title page, a table of contents, and a reference page. For both midterm and final report, information sources from the web, etc. must be cited properly, using APA style. This means that every table that you cut and pasted or typed from the web must have a source at the bottom of the table AND that citing must also be included in a reference page at the end of the report. The parts of the research paper are discussed below. The completed report (parts a through h) is due day 7 of week 6. Your project should include: • An overview of the corporation. ■ Provide general information regarding the type of business, products and/or services, location of headquarters, name of CEO, number of employees, and countries of operation, etc. • The latest financial statements ■ Get the income statement, balance sheet, cash flow statement, and the statement of owners' equity for the past fiscal year. Create Turnitin-friendly versions of the financial statements; do not just 'cut and paste' them in your report. Do not forget to cite the source under each statement. If you cannot cut and paste them, you may have to type in the information in a table in your report. 。 A summary of each financial statement ■ Take each statement and state the key parts in words. Tell a story from each of the financial statements. For example, for the income statement, the story starts like, “Total Revenues in 2010 were $10 billion, while Cost of Goods Sold were $8 billion, leaving a gross profit margin of $2 billion, or 20 percent of total revenues....After taking out interest and taxes from EBIT, the net income was $0.5 billion, or 5 percent of total revenues." 。 Ratio calculation (include 5 major types of ratios, 2-3 ratios per category for a total of 10-15 ratios per company and the industry. Refer to chapter 3, Analysis of Financial Statements) Organization of this section is based on the FIVE types of ratios listed in the text book. Calculate the ratios from the financial statements in part c above using Excel or your calculator and present them in a table. ■ Find industry financial ratios online (ex. Yahoo.com) and compare your corporation's ratios to these industry ratios. ■ Present your results following the five types of ratios, 2-3 ratios per category, 10-15 ratios total per company and the industry discussed in part d. ■ A table with both corporations and industry ratios for five years is required; ⚫ Discussion of key statistics provided by sources like Yahoo finance. There are many different other statistics available for your corporation. These include market value, beta, and diluted EPS, etc. Discuss some of the key statistics that you think can assist you to determine if this corporation is a good buy or sell. ⚫ For you to decide if a corporation's stock is a good buy or sell, you must forecast several key variables, including the stock price. ■ Use historical prices (5 years of monthly data recommended) and forecast the stock price for the next year. Use regression analysis, and/or moving average, etc. to create your forecast. ■ Create a graph from the historical data and show your forecast on the same graph. You can add a trend line to the graph to help you with a forecast. Include the graph in your report. ■ You need to say specifically what the forecasted value of the stock price is. ■ You must address the question, "Is this forecast reasonable?” Must you amend your analysis to get a more reasonable forecast? ⚫ Other information pertinent to the corporation that could affect its future performance and stock price. ■ This could include dividend policy, capital structure, bond ratings, expert opinions on TV, new projects, litigation, regulation, etc. Search for information on the web regarding this corporation. Look at company complaint blogs, etc. • Recommendation regarding the future of this corporation. ■ Is the stock a good buy, average buy, or a poor buy (implying a good sell)? ■ Include a justification of your recommendation based on your analysis and research. Finance 620 Research Paper Grading Rubric FINC 620 RESEARCH PAPER RUBRIC Objective of Paper: The objectives/purpose of the research paper project are to enable you to do a comprehensive financial analysis of a publicly traded corporation; and provide you with substantial information to make recommendations regarding investing in this corporation. (Total Points = 240): • An overview of the corporation Provide general information regarding the type of business, products and/or services, location of headquarters, name of CEO, number of employees, and countries of operation, etc. = 15 points YES NO PARTIAL Total Points Awarded (Possible) = 15 points The latest financial statements & Summary of each financial statement. (b and c) Get the income statement, balance sheet, cash flow statement, and the statement of owners' equity for the past fiscal year. Create SafeAssign- friendly versions of the financial statements; do not just 'cut and paste' them in your report. Do not forget to cite the source under each statement. If you cannot cut and paste them, you may have to type in the information in a table in your report. = 15 points Take each statement and state the key parts in words. Tell a story from each of the financial statements. For example, for the income statement, the story starts like, "Total Revenues in 2010 were $10 billion, while Cost of Goods Sold were $8 billion, leaving a gross profit margin of $2 billion, or 20 percent of total revenues....After taking out interest and taxes from EBIT, the net income was $0.5 billion, or 5 percent of total revenues." points Total Points Awarded (Possible) = 55 points = 40 15 YES NO PARTIAL 55 d. Ratio calculation (include 5 major types of ratios) Organization of this section is based on the FIVE types of ratios, 2-3 ratios per category, for a total of 10-15 ratios per company listed in the text book. Calculate the ratios from the financial statements in part c above using Excel or your calculator and present them in a table. Five years of data required. = 25 points Find industry financial ratios online (eg. Yahoo.com) and compare your corporation's ratios to these industry ratios. Five years of data required. = 15 points Present your results for the five types of ratios, 2-3 per category for a total of 10-15 ratios per company and the industry for five years. A table with both corporations and industry ratios is required for 5 years of data; points = 40 YES NO PARTIAL Total Points Awarded (Possible) = 80 points 80 e. Discussion of key statistics provided by sources like Yahoo finance YES NO PARTIAL There are many different other statistics available for your corporation. These include market value, beta, and diluted EPS, etc. Discuss some of the key statistics that you think can assist you to determine if this corporation is a good buy or sell. =15 points Total Points Awarded ( Possible) = 15 points 15 f. For you to decide if a corporation's stock is a good buy or sell, you must forecast several key variables, including YES NO PARTIAL the stock price Use historical prices (5 years of monthly data recommended) and forecast the stock price for the next year. Use regression analysis, and/or moving average, etc. to create your forecast. = 10 points Create a graph from the historical data and show your forecast on the same graph. You can add a trend line to the graph to help you with a forecast. Include the graph in your report. points = 10 You need to say specifically what the forecasted value of the stock price lis. = 5 points You must address the question, "Is this forecast reasonable?" Must you amend your analysis to get a more reasonable forecast? =10 points Total Points Awarded ( Possible) = 35 points g. Other information pertinent to the corporation that could affect its future performance and stock price AND Recommendation regarding the future of the corporation (g and h) This could include dividend policy, capital structure, bond ratings, expert opinions on TV, new projects, litigation, regulation, etc. Search for information on the web regarding this corporation. Look at company complaint blogs, etc. = 10 points Is the stock a good buy, average buy, or a poor buy (implying a good sell)? Include a justification of your recommendation based on your analysis and research. = 30 points Total Points Awarded ( Possible) = 40 points 35 YES NO PARTIAL 40 Grand total points 240
Expert Answer:
Answer rating: 100% (QA)
Based on the provided instructions it seems you need to prepare a comprehensive financial analysis report of a publicly traded corporation Heres a bre... View the full answer

Related Book For 

Income Tax Fundamentals 2013
ISBN: 9781285586618
31st Edition
Authors: Gerald E. Whittenburg, Martha Altus Buller, Steven L Gill
Posted Date:
Students also viewed these finance questions
-
Research various global financial services organizations (for example, UBS AG, E-Trade, Schwab, ING, Bank of America, HSBC, RBS) through their company websites and other publicly available...
-
List three specific parts of the Case Guide, Objectives and Strategy Section (See below) that you had the most difficulty understanding. Describe your current understanding of these parts. Provide...
-
Comparative figures from the statement of profit or loss of Misty Ltd are shown below: 2017 2016 Revenue (all sales) Cost of sales $450 000 292 300 $390 000 287 000 Gross profit Expenses (including...
-
What is the effective annual rate on a 1-year loan with an interest rate quoted on a discount basis of 20%?
-
Determine the smallest couple moment that can be applied to the 150-lb wheel that will cause impending motion. The uniform concrete block has a weight of 300 lb. The coefficients of static friction...
-
Beng-Yu Woo, Xiaoming Li, and Vivian Hsiun created and patented an invention titled Full Duplex Single Chip Video Codec. At the time, Woo, Li, and Hsiun were employees of Infochips Systems, Inc....
-
Intangible Amortization Presented below is selected information for Palmiero Company. 1. Palmiero purchased a patent from Vania Co. for $1,500,000 on January 1, 2008. The patent is being amortized...
-
An 76 kg man starts from rest and after 1.60 seconds is running at a speed of 11.0 m/s. The force needed for this man to get up to this speed in 1.60 seconds is ____ N.
-
Write a function: string solution (string &S, string &T); that, given two strings S and T consisting of N and M characters, respectively, determines whether string T can be obtained from string S by...
-
Describe two potential solutions to intimate partner violence. Explain the key steps involved in each solution. Explain why the potential solutions are feasible. Explain if there are any conflicts...
-
6.2.6. Several streams are mixed as shown in Figure P6.2.6. Calculate the flows of each stream in kilograms per second. % 4.0 NaCl 5.0 HCI 4.0 HSO4 87.0 HO A B % 9.0 Inert Solid 91.0 HO C D % 2.0 HCI...
-
When an electron is excited from So to S1 in an atom during a molecular absorbance, what accounts for the broadness of the peaks (bands) in the absorbance spectrum? O A. radiationless decay OB....
-
Which of these must be available for mRNA to make it out of the nucleus for translation? Nuclear localization signal Nuclear Export signal O SRP binding site O vesicle binding site
-
12. A test tube is filled with water and closed with a loose fitting stopper that allows air to pass freely. There is a small hole in the base of the test tube as shown in figure. The test tube is...
-
Use the equation of the dissociation of the weak acid and a Le Schatelier principle to answer the following question: What change will be caused by the addition of a small amount of the weak base B...
-
Aerospace Drones has completed its first contract with Department of Defense (DoD) on time and under budget. Company expansion has increased production capacity. R&D continues to set industry...
-
APC16550D UART has a clock running at18.432 MHz and its baud rate is set to 2000.Determine the HEX contents of its DLM and DLL registers. Please can you explain step by step and in detail how you get...
-
Larry and Lisa Williams, both 33 years old, have been married for 9 years. They live at 638 Arctic Way, Fairbanks, AK 99701. Lisa's Social Security number is 445- 81-1423 and Larry's is 798-09-8526....
-
Steve Jackson (age 51) is a single taxpayer living at 3215 Pacific Dr., Del Mar, CA 92014. His Social Security number is 465-88-9415. In 2012, Steve's earnings and income tax withholding as the...
-
Mallory Corporation has a calendar year-end. The corporation has paid estimated payments of $10,000 during 2012 but still owes an additional $5,000 for its 2012 tax year. a. When is the 2012 tax...
-
Which mechanism of bacterial genetic transfer does not require recombination with the bacterial chromosome?
-
Explain why small deletions and duplications are less likely than large ones to have a detrimental effect on an individuals phenotype. If a small deletion within a single chromosome happens to have a...
-
Explain why inversions and reciprocal translocations do not usually cause a phenotypic effect. Then explain how they can do so in certain cases.

Study smarter with the SolutionInn App