The Russell 1000 is a value-weighted index of the largest ~1,000 U.S. stocks. The Russell 2000...
Fantastic news! We've Found the answer you've been seeking!
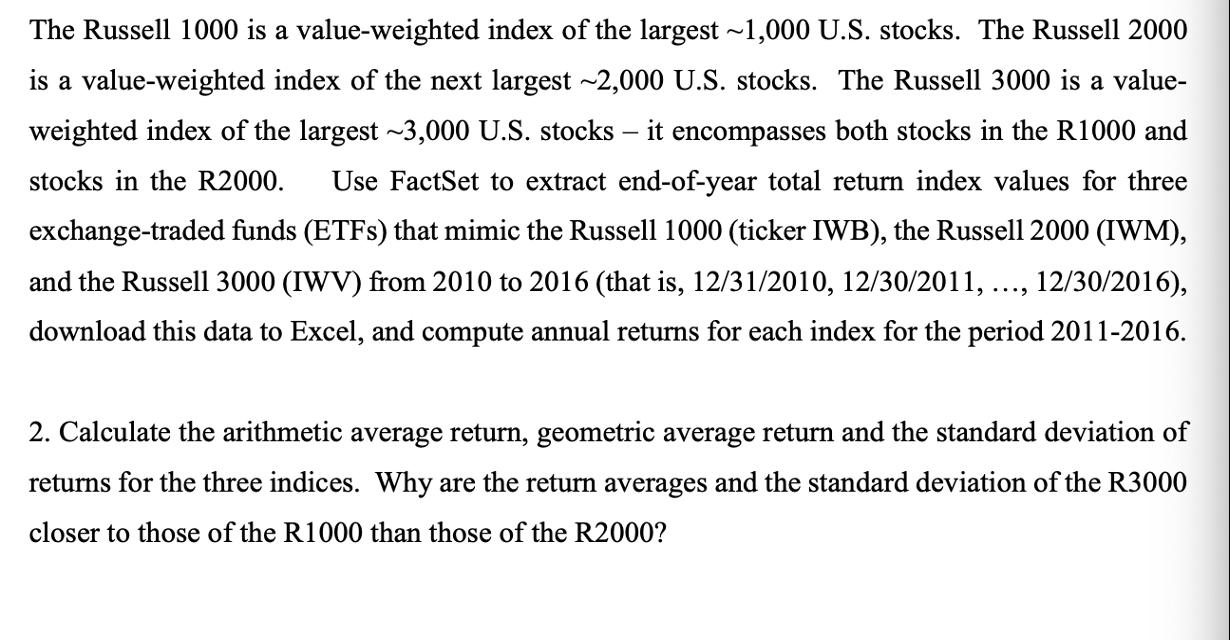
Question:
Transcribed Image Text:
The Russell 1000 is a value-weighted index of the largest ~1,000 U.S. stocks. The Russell 2000 is a value-weighted index of the next largest ~2,000 U.S. stocks. The Russell 3000 is a value- weighted index of the largest ~3,000 U.S. stocks - it encompasses both stocks in the R1000 and stocks in the R2000. Use FactSet to extract end-of-year total return index values for three exchange-traded funds (ETFs) that mimic the Russell 1000 (ticker IWB), the Russell 2000 (IWM), and the Russell 3000 (IWV) from 2010 to 2016 (that is, 12/31/2010, 12/30/2011, ..., 12/30/2016), download this data to Excel, and compute annual returns for each index for the period 2011-2016. 2. Calculate the arithmetic average return, geometric average return and the standard deviation of returns for the three indices. Why are the return averages and the standard deviation of the R3000 closer to those of the R1000 than those of the R2000? The Russell 1000 is a value-weighted index of the largest ~1,000 U.S. stocks. The Russell 2000 is a value-weighted index of the next largest ~2,000 U.S. stocks. The Russell 3000 is a value- weighted index of the largest ~3,000 U.S. stocks - it encompasses both stocks in the R1000 and stocks in the R2000. Use FactSet to extract end-of-year total return index values for three exchange-traded funds (ETFs) that mimic the Russell 1000 (ticker IWB), the Russell 2000 (IWM), and the Russell 3000 (IWV) from 2010 to 2016 (that is, 12/31/2010, 12/30/2011, ..., 12/30/2016), download this data to Excel, and compute annual returns for each index for the period 2011-2016. 2. Calculate the arithmetic average return, geometric average return and the standard deviation of returns for the three indices. Why are the return averages and the standard deviation of the R3000 closer to those of the R1000 than those of the R2000?
Expert Answer:
Answer rating: 100% (QA)
As an AI language model I dont have direct access to external databases or FactSet However I can guide you through the process of calculating the arithmetic average return geometric average return and ... View the full answer
Related Book For
Basic Business Statistics Concepts And Applications
ISBN: 9780132168380
12th Edition
Authors: Mark L. Berenson, David M. Levine, Timothy C. Krehbiel
Posted Date:
Students also viewed these finance questions
-
The Russell 1000 is a stock market index consisting of the largest U.S. companies. The Dow Jones industrial Average is based on 30 large companies. The data giving the annual percentage returns for...
-
a. Commonwealth Bank of Australia (CBA) has reported a 99% Value at Risk (VaR) of 3.09% over a 1268 trading period. What does this mean? b. Why do some investors prefer to use Lower Partial Standard...
-
The following additional information is available for the Dr. Ivan and Irene Incisor family from Chapters 1-5. Ivan's grandfather died and left a portfolio of municipal bonds. In 2012, they pay Ivan...
-
Rice and Flower were partners sharing profit and loss equally. Statement of Financial Position as at 31 December 2020. Non current Assets Premises Machinery Vehicles Fittings Current Assets Inventory...
-
Identifying Effects of Transactions on the Statement of Cash Flows Refer to AP2-3. Required: Using the events (a) through (h) in AP2-3, indicate whether each transaction is an investing (I) or...
-
7. 1. Explain the difference between an array-based and a linked representation of a list. 2. Give an example of a problem for which an array-based list would be the better solution. 3. Give an...
-
Xie Company identified the following activities, costs, and activity drivers for 2017. The company manufactures two types of go-karts: deluxe and basic. Required 1. Compute a single plantwide...
-
Projects A and B, of equal risk, are alternatives for expanding Rosa Company's capacity. The firm's cost of capital is 13%. The cash flows for each project are shown in the following table. a....
-
which of these items are included in the calculation of an asset's adjusted basis? add costs necessary to prepare the asset for use in the business, start with the asset's original basis, subtract...
-
The figure shows a graph of r as a function of in Cartesian coordinates. Use it to sketch the corresponding polar curve. 2. 14 -1-
-
Investor Inc invested $150,000 in Investee Inc on January 1, 20X3 Investor Inc classified its investment in Investee Inc as an FVTOCI investment Investor Inc received dividends of $15,000 during the...
-
research further and consider whether this is something you need to document in a series of observations first and discuss (if so, who with) 5. Following on from Q4, you notice that Hanna has become...
-
The most recent financial statements for Cardinal, Inc., are shown here: Income Statement Balance Sheet Sales $ 31,400 Assets $ 74,000 Debt $ 37,400 Costs 18,450 Equity 36,600 Taxable income $ 12,950...
-
DCI currently uses a warehouse management system (WMS) and a transportationmanagement system (TMS) in its distribution center in Mississauga. With distributionout of only one location, the WMS and...
-
subject -----SITXHRM003 Lead and manage people You are the manager of a large new venue. You have employed full staff and one of the policies is to encourage the staff to meet goals and KPI's and...
-
Mr Dinakahinga,a resident citizen, head of family, died on January 15, 2020, leaving the following properties and obligations: Cash in bank, 50%, donated mortis causa 300,000 to Nat'l Govt, 50% to QC...
-
Find g(0) g(3) g(5) . g(8) 2 N -1 3 2 1 0 -1 -2 -3 -5 6 Let g(x) = lim h->0 - 2 3 f(a+h)-f(a) h 5 6 7 8 f(x) 9 10
-
Explain briefly what is meant by electronic data interchange (EDI). How does EDI affect a companys audit trail?
-
Why is it true that for a given sample size, n, an increase in confidence is achieved by widening (and making less precise) the confidence interval?
-
How have stocks performed in the past? The following table presents the data stored in Stock Performance, which show the performance of a broad measure of stock performance (by percentage) for each...
-
The following information is available for two samples selected from independent and similarly shaped right skewed populations: Sample 1: n1 = 5 1.1 2.3 2.9 3.6 14.7 Sample 2: n2 = 6 2.8 4.4 4.4 5.2...
-
Martinez Company incurred the following costs during 2015 in connection with its research and development activities. Instructions Compute the amount to be reported as research and development...
-
For each of the following studies, identify the type of graph (histogram, time series graph, or scatter diagram) that would be the most appropriate. (You can use more than one graph of each type, for...
-
Explain the difference between artistic-related intangible assets and contract-related intangible assets.
Study smarter with the SolutionInn App