

Question: The selected graphs shown are not correct. please explain how to solve thank you Consider the following samples of gas: sample composition pressure temperature sample
The selected graphs shown are not correct. please explain how to solve thank you 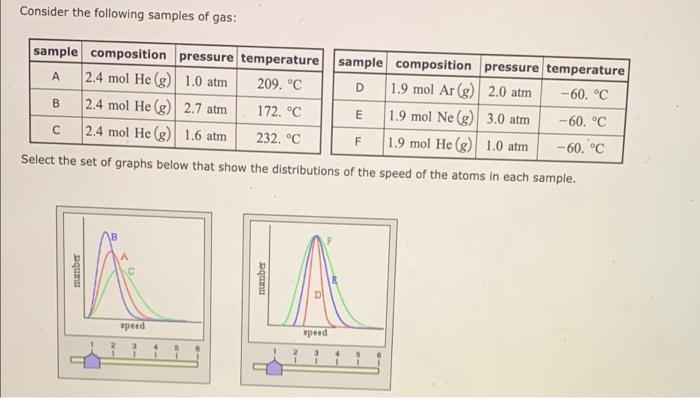
Consider the following samples of gas: sample composition pressure temperature sample composition pressure temperature A 2.4 mol He(g) 1.0 atm 209. C D 1.9 mol Ar (g) 2.0 atm -60. C B 2.4 mol He (g) 2.7 atm 172. C E 1.9 mol Ne (g) 3.0 atm -60C 2.4 mol He (g) 1.6 atm 232. C F 1.9 mol He (g) 1.0 atm -60C Select the set of graphs below that show the distributions of the speed of the atoms in each sample. M mumber speed wpeed
Step by Step Solution
There are 3 Steps involved in it
1 Expert Approved Answer
Step: 1 Unlock

Question Has Been Solved by an Expert!
Get step-by-step solutions from verified subject matter experts
Step: 2 Unlock
Step: 3 Unlock