

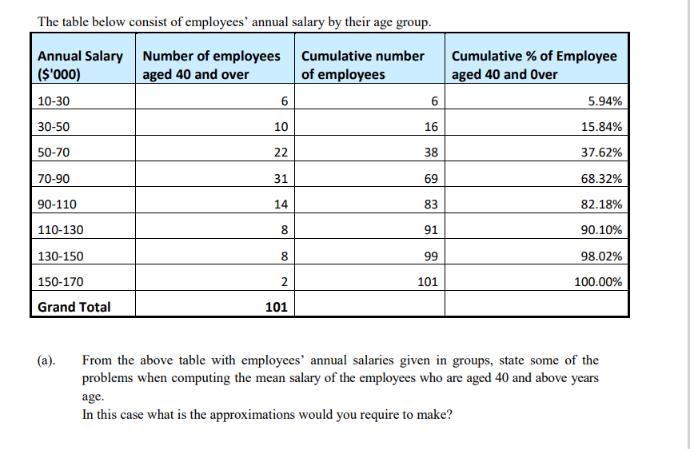
The table below consist of employees' annual salary by their age group. Annual Salary ($'000) Cumulative...
Fantastic news! We've Found the answer you've been seeking!
Question:
Transcribed Image Text:
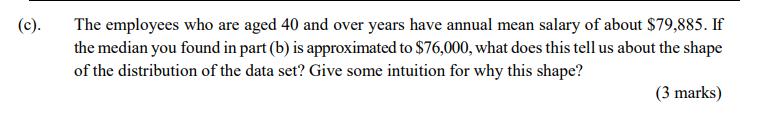
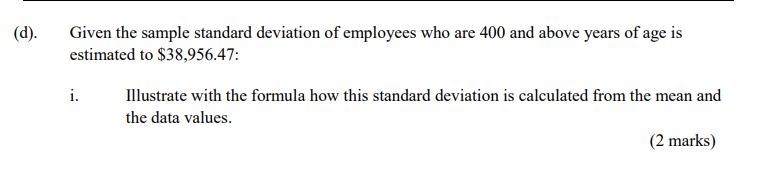
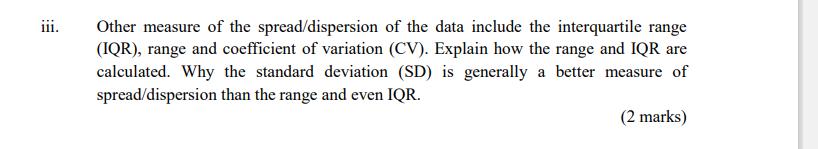
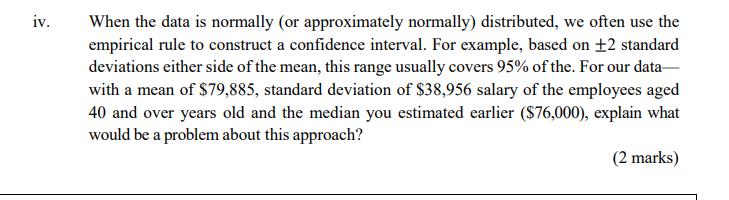
The table below consist of employees' annual salary by their age group. Annual Salary ($'000) Cumulative number of employees 10-30 30-50 50-70 70-90 90-110 110-130 130-150 150-170 Grand Total (a). Number of employees aged 40 and over 6 10 22 31 14 8 00 8 2 101 6 16 38 69 83 91 99 101 Cumulative % of Employee aged 40 and Over 5.94% 15.84% 37.62% 68.32% 82.18% 90.10% 98.02% 100.00% From the above table with employees' annual salaries given in groups, state some of the problems when computing the mean salary of the employees who are aged 40 and above years age. In this case what is the approximations would you require to make? (b). Next we want to evaluate the median annual salary. In this case, What is the definition of the median? i. ii. Based on the table above, describe how you would calculate the median annual salary of the employees aged 40 and over years. (2 marks) iii. Using the above method you have described in the previous question, give the median estimate for the median for the employees aged 40 and above years old. (1 mark) (c). The employees who are aged 40 and over years have annual mean salary of about $79,885. If the median you found in part (b) is approximated to $76,000, what does this tell us about the shape of the distribution of the data set? Give some intuition for why this shape? (3 marks) (d). Given the sample standard deviation of employees who are 400 and above years of age is estimated to $38,956.47: i. Illustrate with the formula how this standard deviation is calculated from the mean and the data values. (2 marks) iii. Other measure of the spread/dispersion of the data include the interquartile range (IQR), range and coefficient of variation (CV). Explain how the range and IQR are calculated. Why the standard deviation (SD) is generally a better measure of spread/dispersion than the range and even IQR. (2 marks) iv. When the data is normally (or approximately normally) distributed, we often use the empirical rule to construct a confidence interval. For example, based on ±2 standard deviations either side of the mean, this range usually covers 95% of the. For our data- with a mean of $79,885, standard deviation of $38,956 salary of the employees aged 40 and over years old and the median you estimated earlier ($76,000), explain what would be a problem about this approach? (2 marks) The table below consist of employees' annual salary by their age group. Annual Salary ($'000) Cumulative number of employees 10-30 30-50 50-70 70-90 90-110 110-130 130-150 150-170 Grand Total (a). Number of employees aged 40 and over 6 10 22 31 14 8 00 8 2 101 6 16 38 69 83 91 99 101 Cumulative % of Employee aged 40 and Over 5.94% 15.84% 37.62% 68.32% 82.18% 90.10% 98.02% 100.00% From the above table with employees' annual salaries given in groups, state some of the problems when computing the mean salary of the employees who are aged 40 and above years age. In this case what is the approximations would you require to make? (b). Next we want to evaluate the median annual salary. In this case, What is the definition of the median? i. ii. Based on the table above, describe how you would calculate the median annual salary of the employees aged 40 and over years. (2 marks) iii. Using the above method you have described in the previous question, give the median estimate for the median for the employees aged 40 and above years old. (1 mark) (c). The employees who are aged 40 and over years have annual mean salary of about $79,885. If the median you found in part (b) is approximated to $76,000, what does this tell us about the shape of the distribution of the data set? Give some intuition for why this shape? (3 marks) (d). Given the sample standard deviation of employees who are 400 and above years of age is estimated to $38,956.47: i. Illustrate with the formula how this standard deviation is calculated from the mean and the data values. (2 marks) iii. Other measure of the spread/dispersion of the data include the interquartile range (IQR), range and coefficient of variation (CV). Explain how the range and IQR are calculated. Why the standard deviation (SD) is generally a better measure of spread/dispersion than the range and even IQR. (2 marks) iv. When the data is normally (or approximately normally) distributed, we often use the empirical rule to construct a confidence interval. For example, based on ±2 standard deviations either side of the mean, this range usually covers 95% of the. For our data- with a mean of $79,885, standard deviation of $38,956 salary of the employees aged 40 and over years old and the median you estimated earlier ($76,000), explain what would be a problem about this approach? (2 marks)
Expert Answer:

Related Book For 

Financial Reporting Financial Statement Analysis and Valuation a strategic perspective
ISBN: 978-1337614689
9th edition
Authors: James M. Wahlen, Stephen P. Baginski, Mark Bradshaw
Posted Date:
Students also viewed these accounting questions
-
A researcher wanted to find out if there was difference between older movie goers and younger movie goers with respect to their estimates of a successful actors income. The researcher first...
-
The following additional information is available for the Dr. Ivan and Irene Incisor family from Chapters 1-5. Ivan's grandfather died and left a portfolio of municipal bonds. In 2012, they pay Ivan...
-
What theoretical relationship should there be between the standard deviation in Problem 6.48 and the standard deviation in Problem 6.49? Table 6.2: Sample of birth-weights (oz) obtained from 1000...
-
Requests are not usually uniformly distributed. For example, a cylinder containing the file system FAT or in odes can be expected to be accessed more frequently than a cylinder that only contains...
-
What is the market interest rate on Harry Daviss debt and it component cost of debt? During the last few years, Harry Davis Industries has been too constrained by the high cost of capital to make...
-
Flannel and Flounder Ltd (see exercise 2, 34.5) use 2.5 litres of material in each unit of their product. The price of the material is currently $4.10 per litre, but the company has learned that the...
-
Fresh Food Direct, LLC, entered into a lease agreement with Jet Star Realty, LLC. Fresh Food terminated the lease before its terms end, and the parties disputed the amount of rent that Fresh Food...
-
The Royal Seas Company runs a three-night cruise to the Caribbean from Port Canaveral. The company wants to run TV ads promoting its cruises to high-income men, high-income women, and retirees. The...
-
Why, in fact, does Marxism breed regimes which are totalitarian in nature? How does multiculturalism at play?
-
This case can be assigned as a group activity. Additional instructions and material for this activity can be found on the Instructor Resource site and in WileyPLUS. Kenmare Architects Ltd. (KAL) was...
-
The following information about two mutually exclusive projects R and S are relevant for requirements 1(a) to 1(c) only. Max-W Company is considering investing in project R, which will require an...
-
Doggie Pawz produces two models of dog beds: rectangle and circle. The following information about the costs to produce the companys products has been provided. Category Estimated Cost Cost Driver...
-
The following information is available for the first month of operations of Kleinfeld Company, a manufacturer of wall clocks: Sales $1,460,300 Beginning Work in process 82,400 Beginning Finished...
-
Use the method of averages to find the approximate yield rate for the bond shown in the table below. The bond is to be redeemed at par. Face Value $24,000 Bond Rate Payable Semi-annually Time Before:...
-
On January 1, 2018, the general ledger of ACME Fireworks includes the following account balances: Accounts Debit Credit Cash $ 26,900 Accounts Receivable 49,800 Allowance for Uncollectible Accounts...
-
1. Review the case entitled Wal-Mart Stores, Inc. v. Cockrell on page 87 of the textbook (Case 5.1). Using the IRAC form discussed earlier, state the issue that this case is analyzing. What is the...
-
Oslo, the capital city of Norway, is located at approximately 60N as shown in Figure B1 below. What is the noon sun angle on the June solstice at this latitude? 20 0 20 40 ---+ 40 60 Tropic of Cancer...
-
A circular concrete shaft liner with Youngs modulus of 3.4 million psi, Poissons ratio of 0.25, unconfined compressive strength 3,500 psi and tensile strength 350 psi is loaded to the verge of...
-
BTB Electronics Inc. manufactures parts, components, and processing equipment for electronics and semiconductor applications in the communications, computer, automotive, and appliance industries. Its...
-
Sunbeam Corporation manufactures and sells a variety of small household appliances, including toasters, food processors, and waffle grills. Exhibit 3.21 presents a statement of cash flows for Sunbeam...
-
Three years of combined data for two firms appear below (in millions). One of these firms is FedEx, a relatively high-growth firm that provides courier services, and the other is Kellogg Company, a...
-
Scientists propose that the first macromolecules in protobionts were a. DNA molecules. b. RNA molecules. c. proteins. d. all of the above.
-
Which of the following function(s) is/are carried out by piRITS or piRISC? a. Inhibits transcription of TEs b. Causes the degradation of TE RNA c. Causes chromosome breakage d. Both a and b are...
-
In the CRISPR-Cas system, what does tracrRNA bind to? a. crRNA and Cas1 protein b. crRNA and Cas2 protein c. crRNA and Cas9 protein d. Cas1 and Cas2 proteins

Study smarter with the SolutionInn App