

Instructions: You must write the answers using your OWN words. Do not copy another students work...
Fantastic news! We've Found the answer you've been seeking!
Question:
Transcribed Image Text:
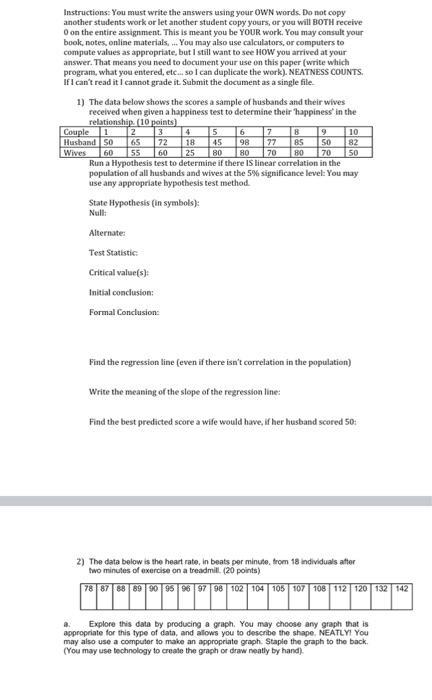
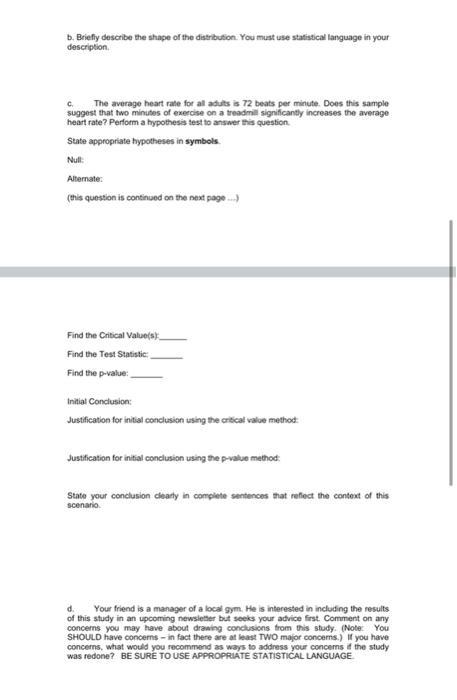
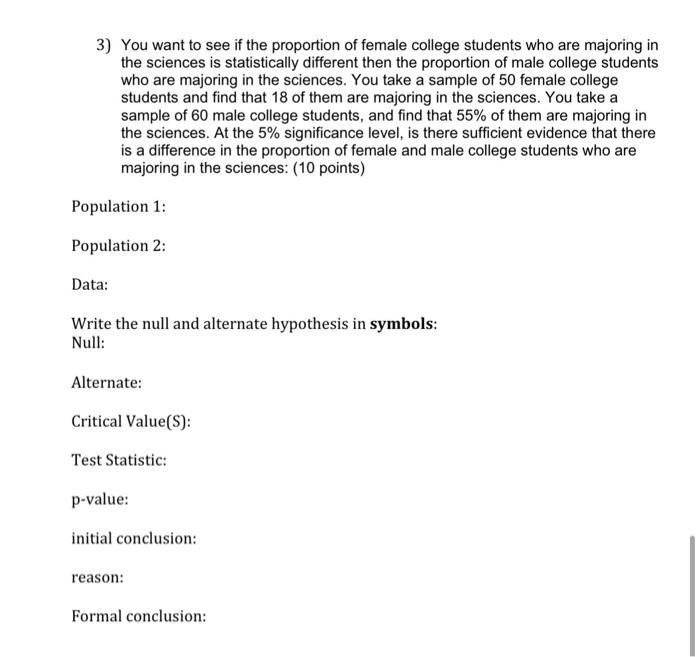
Instructions: You must write the answers using your OWN words. Do not copy another students work or let another student copy yours, or you will BOTH receive 0 on the entire assignment. This is meant you be YOUR work. You may consult your book, notes, online materials,... You may also use calculators, or computers to compute values as appropriate, but I still want to see HOW you arrived at your answer. That means you need to document your use on this paper (write which program, what you entered, etc... so I can duplicate the work). NEATNESS COUNTS. If I can't read it I cannot grade it. Submit the document as a single file. 1) The data below shows the scores a sample of husbands and their wives received when given a happiness test to determine their happiness in the relationship. (10 points) 1 Couple Husband 50 Wives 2 65 55 60 3 72 5 6 7 8 9 10 45 98 77 85 50 82 60 25 80 80 70 80 70 50 Run a Hypothesis test to determine if there IS linear correlation in the population of all husbands and wives at the 5% significance level: You may use any appropriate hypothesis test method. 4 18 State Hypothesis (in symbols): Null: Alternate: Test Statistic: Critical value(s): Initial conclusion: Formal Conclusion: Find the regression line (even if there isn't correlation in the population) Write the meaning of the slope of the regression line: Find the best predicted score a wife would have, if her husband scored 50: 2) The data below is the heart rate, in beats per minute, from 18 individuals after two minutes of exercise on a treadmill. (20 points) 78 87 88 89 90 95 96 97 98 102 104 105 107 108 112 120 132 142 a. Explore this data by producing a graph. You may choose any graph that is appropriate for this type of data, and allows you to describe the shape, NEATLY! You may also use a computer to make an appropriate graph. Staple the graph to the back. (You may use technology to create the graph or draw neatly by hand). b. Briefly describe the shape of the distribution. You must use statistical language in your description. C. The average heart rate for all adults is 72 beats per minute. Does this sample suggest that two minutes of exercise on a treadmill significantly increases the average heart rate? Perform a hypothesis test to answer this question. State appropriate hypotheses in symbols Null: Alternate: (this question is continued on the next page...) Find the Critical Value(s) Find the Test Statistic Find the p-value: Initial Conclusion: Justification for initial conclusion using the critical value method: Justification for initial conclusion using the p-value method: State your conclusion clearly in complete sentences that reflect the context of this scenario. d. Your friend is a manager of a local gym. He is interested in including the results. of this study in an upcoming newsletter but seeks your advice first. Comment on any concerns you may have about drawing conclusions from this study. (Note: You SHOULD have concerns-in fact there are at least TWO major concerns.) If you have concerns, what would you recommend as ways to address your concerns if the study was redone? BE SURE TO USE APPROPRIATE STATISTICAL LANGUAGE 3) You want to see if the proportion of female college students who are majoring in the sciences is statistically different then the proportion of male college students who are majoring in the sciences. You take a sample of 50 female college students and find that 18 of them are majoring in the sciences. You take a sample of 60 male college students, and find that 55% of them are majoring in the sciences. At the 5% significance level, is there sufficient evidence that there is a difference in the proportion of female and male college students who are majoring in the sciences: (10 points) Population 1: Population 2: Data: Write the null and alternate hypothesis in symbols: Null: Alternate: Critical Value(S): Test Statistic: p-value: 11 initial conclusion: reason: Formal conclusion: Instructions: You must write the answers using your OWN words. Do not copy another students work or let another student copy yours, or you will BOTH receive 0 on the entire assignment. This is meant you be YOUR work. You may consult your book, notes, online materials,... You may also use calculators, or computers to compute values as appropriate, but I still want to see HOW you arrived at your answer. That means you need to document your use on this paper (write which program, what you entered, etc... so I can duplicate the work). NEATNESS COUNTS. If I can't read it I cannot grade it. Submit the document as a single file. 1) The data below shows the scores a sample of husbands and their wives received when given a happiness test to determine their happiness in the relationship. (10 points) 1 Couple Husband 50 Wives 2 65 55 60 3 72 5 6 7 8 9 10 45 98 77 85 50 82 60 25 80 80 70 80 70 50 Run a Hypothesis test to determine if there IS linear correlation in the population of all husbands and wives at the 5% significance level: You may use any appropriate hypothesis test method. 4 18 State Hypothesis (in symbols): Null: Alternate: Test Statistic: Critical value(s): Initial conclusion: Formal Conclusion: Find the regression line (even if there isn't correlation in the population) Write the meaning of the slope of the regression line: Find the best predicted score a wife would have, if her husband scored 50: 2) The data below is the heart rate, in beats per minute, from 18 individuals after two minutes of exercise on a treadmill. (20 points) 78 87 88 89 90 95 96 97 98 102 104 105 107 108 112 120 132 142 a. Explore this data by producing a graph. You may choose any graph that is appropriate for this type of data, and allows you to describe the shape, NEATLY! You may also use a computer to make an appropriate graph. Staple the graph to the back. (You may use technology to create the graph or draw neatly by hand). b. Briefly describe the shape of the distribution. You must use statistical language in your description. C. The average heart rate for all adults is 72 beats per minute. Does this sample suggest that two minutes of exercise on a treadmill significantly increases the average heart rate? Perform a hypothesis test to answer this question. State appropriate hypotheses in symbols Null: Alternate: (this question is continued on the next page...) Find the Critical Value(s) Find the Test Statistic Find the p-value: Initial Conclusion: Justification for initial conclusion using the critical value method: Justification for initial conclusion using the p-value method: State your conclusion clearly in complete sentences that reflect the context of this scenario. d. Your friend is a manager of a local gym. He is interested in including the results. of this study in an upcoming newsletter but seeks your advice first. Comment on any concerns you may have about drawing conclusions from this study. (Note: You SHOULD have concerns-in fact there are at least TWO major concerns.) If you have concerns, what would you recommend as ways to address your concerns if the study was redone? BE SURE TO USE APPROPRIATE STATISTICAL LANGUAGE 3) You want to see if the proportion of female college students who are majoring in the sciences is statistically different then the proportion of male college students who are majoring in the sciences. You take a sample of 50 female college students and find that 18 of them are majoring in the sciences. You take a sample of 60 male college students, and find that 55% of them are majoring in the sciences. At the 5% significance level, is there sufficient evidence that there is a difference in the proportion of female and male college students who are majoring in the sciences: (10 points) Population 1: Population 2: Data: Write the null and alternate hypothesis in symbols: Null: Alternate: Critical Value(S): Test Statistic: p-value: 11 initial conclusion: reason: Formal conclusion:
Expert Answer:
Answer rating: 100% (QA)
Step 1 Find XY X and Y2 as it was done in the table bel... View the full answer

Related Book For 
Microeconomics Theory and Applications with Calculus
ISBN: 978-0133019933
3rd edition
Authors: Jeffrey M. Perloff
Posted Date:
Students also viewed these mathematics questions
-
Q1. What is the NPV profile? What question does it aim to answer? (Hint: what are on the y-axis and x-axis on an NPV profile? Q2. Suppose a project's NPV Profile is as follows: $500 $400 $300 $200...
-
Winning team data were collected for teams in different sports, with the results given in the accompanying table. Use a 0.10 level of significance to test the claim that home/visitor wins are...
-
In games where a team is favored by more than 12 points, the margin of victory for the favored team relative to the spread is normally distributed with a mean of -1.0 point and a standard deviation...
-
Estimate the errors involved in Exercise 63, parts (a) and (b). How large should be in each case to guarantee an error of less than 0.00001?
-
Interview an operations manager at a nearby manufacturing or service company to find out about scheduling problems the company faces and how they are addressed.
-
Provide two examples of tests of details of balances and transactions.
-
Assume the unadjusted and adjusted trial balances for Milky Way Theater, Inc., at November 30, 2010, show the following data: Requirement 1. Journalize the adjusting entries that account for the...
-
Alice Johnson, Social Security number 222-23-3334, is single taxpayer and is employed as a secretary by State University of Florida. She has the following items pertaining to her income tax return...
-
Return on Investment and Residual Income Simonsen Structural Engineers provides engineering consulting services to clients engaged in major commercial construction projects. The company expanded into...
-
Based on Reed Hospital Break Even Analysis, answer the following questions: 1. Although you are basically satisfied with the analysis presented in the case thus far, you are concerned about the...
-
Thirty-Eight Who Saw Murder and Didn't Call the Police"-Martin Gansberg 1. What details of this murder transformed it from a local crime story into an event that captured national attention? 2. How...
-
Explain the linkage between site design and marketing objectives.
-
What impact do apps, widgets and QR codes have on the marketing mix?
-
List the different types of viral marketing campaigns for which you have been a recipient. Which could be effective for your own organization?
-
Explain the principles and purpose of content marketing.
-
Explain the principle and activities of social media optimization (SMO)
-
Near the end of 2023, Blair has worked the following number of hours in each of several nonrental activities (the expected profit or loss of each activity for 2023 is also disclosed): Hours Worked...
-
Name some of the various types of financial intermediaries described in the chapter and indicate the primary reason(s) each was created.
-
Sometimes a firm sells the same product under two brand names. For example, the Chevy Tahoe and the GMC Yukon are virtually twins (although the Yukon sells for $490 more than the Tahoe). Give an...
-
If the inverse demand function for toasters is p = 60 - q, what is the consumer surplus if the price is 30?
-
Prescott (2004) argued that U.S. employees work 50% more than do German, French, and Italian employees because European employees face lower marginal tax rates. Assuming that workers in all four...
-
Determine the displacement of point \(C\). The beam is made from A992 steel and has a moment of inertia of \(I=53.8 \mathrm{in}^{4}\). 8 kip A B -5 ft- -10 ft 5 ft-
-
Determine the slope at \(B\). The beam is made from A992 steel and has a moment of inertia of \(I=53.8 \mathrm{in}^{4}\). 8 kip A B -5 ft- 10 ft- -5 ft-
-
The beam is made of Douglas fir. Determine the slope at \(C\). 8 kN BO -1.5m 1.5m- -1.5 m- 180 mm H 120 mm
Host Guest Chemistry Supramolecular Inclusion In Solution 1st Edition - ISBN: 311056436X - Free Book

Study smarter with the SolutionInn App