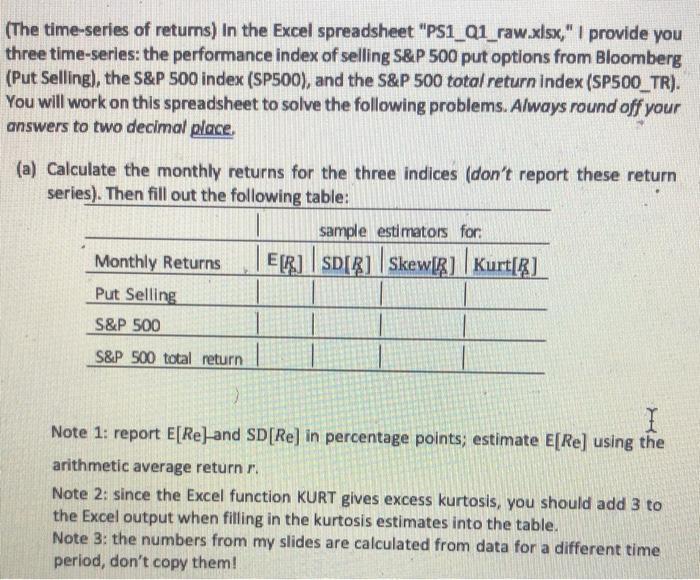
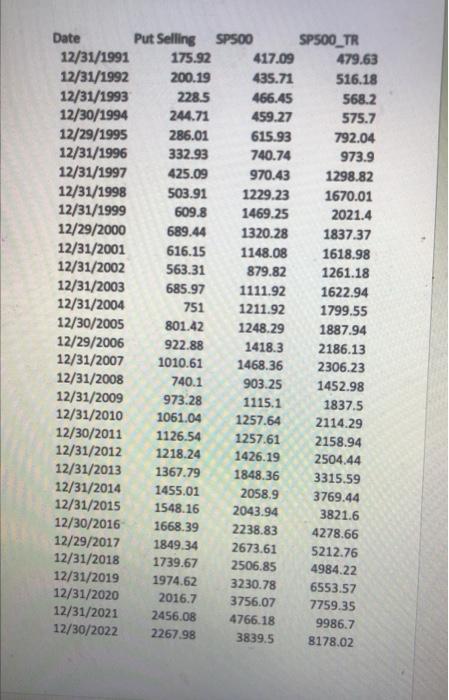
(The time-series of returns) In the Excel spreadsheet PS1_Q1_raw.xlsx, I provide you three time-series: the performance...
Fantastic news! We've Found the answer you've been seeking!
Question:
Transcribed Image Text:
(The time-series of returns) In the Excel spreadsheet "PS1_Q1_raw.xlsx," I provide you three time-series: the performance index of selling S&P 500 put options from Bloomberg (Put Selling), the S&P 500 index (SP500), and the S&P 500 total return index (SP500_TR). You will work on this spreadsheet to solve the following problems. Always round off your answers to two decimal place. (a) Calculate the monthly returns for the three indices (don't report these return series). Then fill out the following table: Monthly Returns Put Selling S&P 500 S&P 500 total return ) sample estimators for: ER SDIR] Skew[R] Kurt[R] I Note 1: report E[Re]-and SD [Re] in percentage points; estimate E[Re] using the arithmetic average return r. Note 2: since the Excel function KURT gives excess kurtosis, you should add 3 to the Excel output when filling in the kurtosis estimates into the table. Note 3: the numbers from my slides are calculated from data for a different time period, don't copy them! Put Selling SP500 175.92 200.19 228.5 244.71 286.01 332.93 425.09 503.91 609.8 689.44 616.15 563.31 685.97 751 12/30/2005 801.42 12/29/2006 922.88 12/31/2007 1010.61 12/31/2008 740.1 12/31/2009 973.28 12/31/2010 1061.04 12/30/2011 1126.54 12/31/2012 1218.24 12/31/2013 1367.79 12/31/2014 1455.01 12/31/2015 1548.16 12/30/2016 1668.39 Date 12/31/1991 12/31/1992 12/31/1993 12/30/1994 12/29/1995 12/31/1996 12/31/1997 12/31/1998 12/31/1999 12/29/2000 12/31/2001 12/31/2002 12/31/2003 12/31/2004 12/29/2017 12/31/2018 1849.34 1739.67 12/31/2019 1974.62 12/31/2020 2016.7 12/31/2021 2456.08 12/30/2022 2267.98 417.09 479.63 435.71 516.18 466.45 568.2 459.27 575.7 615.93 792.04 740.74 973.9 970.43 1298.82 1229.23 1670.01 1469.25 2021.4 1320.28 1837.37 1618.98 1261.18 1622.94 1799.55 1148.08 879.82 1111.92 1211.92 1248.29 1418.3 1468.36 903.25 1115.1 1257.64 1257.61 1426.19 1848.36 2058.9 2043.94 2238.83 2673.61 2506.85 SP500 TR 3230.78 3756.07 4766.18 3839.5 1887.94 2186.13 2306.23 1452.98 1837.5 2114.29 2158.94 2504.44 3315.59 3769.44 3821.6 4278.66 5212.76 4984.22 6553.57 7759.35 9986.7 8178.02 (The time-series of returns) In the Excel spreadsheet "PS1_Q1_raw.xlsx," I provide you three time-series: the performance index of selling S&P 500 put options from Bloomberg (Put Selling), the S&P 500 index (SP500), and the S&P 500 total return index (SP500_TR). You will work on this spreadsheet to solve the following problems. Always round off your answers to two decimal place. (a) Calculate the monthly returns for the three indices (don't report these return series). Then fill out the following table: Monthly Returns Put Selling S&P 500 S&P 500 total return ) sample estimators for: ER SDIR] Skew[R] Kurt[R] I Note 1: report E[Re]-and SD [Re] in percentage points; estimate E[Re] using the arithmetic average return r. Note 2: since the Excel function KURT gives excess kurtosis, you should add 3 to the Excel output when filling in the kurtosis estimates into the table. Note 3: the numbers from my slides are calculated from data for a different time period, don't copy them! Put Selling SP500 175.92 200.19 228.5 244.71 286.01 332.93 425.09 503.91 609.8 689.44 616.15 563.31 685.97 751 12/30/2005 801.42 12/29/2006 922.88 12/31/2007 1010.61 12/31/2008 740.1 12/31/2009 973.28 12/31/2010 1061.04 12/30/2011 1126.54 12/31/2012 1218.24 12/31/2013 1367.79 12/31/2014 1455.01 12/31/2015 1548.16 12/30/2016 1668.39 Date 12/31/1991 12/31/1992 12/31/1993 12/30/1994 12/29/1995 12/31/1996 12/31/1997 12/31/1998 12/31/1999 12/29/2000 12/31/2001 12/31/2002 12/31/2003 12/31/2004 12/29/2017 12/31/2018 1849.34 1739.67 12/31/2019 1974.62 12/31/2020 2016.7 12/31/2021 2456.08 12/30/2022 2267.98 417.09 479.63 435.71 516.18 466.45 568.2 459.27 575.7 615.93 792.04 740.74 973.9 970.43 1298.82 1229.23 1670.01 1469.25 2021.4 1320.28 1837.37 1618.98 1261.18 1622.94 1799.55 1148.08 879.82 1111.92 1211.92 1248.29 1418.3 1468.36 903.25 1115.1 1257.64 1257.61 1426.19 1848.36 2058.9 2043.94 2238.83 2673.61 2506.85 SP500 TR 3230.78 3756.07 4766.18 3839.5 1887.94 2186.13 2306.23 1452.98 1837.5 2114.29 2158.94 2504.44 3315.59 3769.44 3821.6 4278.66 5212.76 4984.22 6553.57 7759.35 9986.7 8178.02
Expert Answer:
Answer rating: 100% (QA)
PS1Q1rawxlsx Analysis Monthly Return Statistics Note I cannot access or modify your spreadsheet dire... View the full answer
Related Book For
Managerial Economics
ISBN: 978-0133020267
7th edition
Authors: Paul Keat, Philip K Young, Steve Erfle
Posted Date:
Students also viewed these finance questions
-
List three specific parts of the Case Guide, Objectives and Strategy Section (See below) that you had the most difficulty understanding. Describe your current understanding of these parts. Provide...
-
Planning is one of the most important management functions in any business. A front office managers first step in planning should involve determine the departments goals. Planning also includes...
-
Managing Scope Changes Case Study Scope changes on a project can occur regardless of how well the project is planned or executed. Scope changes can be the result of something that was omitted during...
-
Investor's Report Objectives: You will conduct financial statement analysis of two comparable companies and provide recommendations about the financial position about each for two investors. Select...
-
Epic Video has the following unadjusted trial balance as of July 31, 2008: The debit and credit totals are not equal as a result of the following errors: a. The balance of cash was overstated by...
-
On September 1, 202X, Mia Kaminsky opened Mias Art Studio. The following transactions occurred in September: Your tasks are to do the following: a. Set up the ledger based on the following chart of...
-
An indirect way of measuring of secondary emission from ponds or large bodies of water used in waste treatment is to measure the concentration and velocity over the surface. The data can then be...
-
CVP analysis, shoe stores (continuation of 3-38). Refer to requirement 3 of Problem 3-38. In this problem, assume the role of the owner of WalkRite. 1. Calculate the number of units sold at which the...
-
How can advances in psychoneuroimmunology shed light on the bidirectional communication between the central nervous system and the immune system in the context of stress, and what implications does...
-
Explain the difference between a discrete and a continuous variable. Give an example of each not included in the text.
-
Investigate the evolutionary origins and adaptive significance of complex biological phenomena, such as altruistic behavior, sociality, and cooperation, considering their genetic, ecological, and...
-
The work done in stretching a wire by 0.2 mm is 8 J. What will be the work done in stretching another wire of same material, but with double the radius and half the length by 0.2 mm?
-
The electric field at a distance x above one end of a straight conducting wire of length L carrying a uniform linear charge density A is (use standard Cartesian coordinates) A. (8) = 8 82+L2 + L...
-
What is Recruitment? Explain the factors affecting Recruitment.
-
Find the values of a, b, c, and d which satisfy the matrix equation. [a+c a+2b [0 -7] e-1 4d-6 13 2d
-
Explain the two methods used for estimating Fishing Mortality rate
-
By induction prove that Vn E Z+, Problem 2. [25 points] By induction prove that Vn Z+, IM 2 n(n + 1)(2n+1) 6 (3)-3 m Hint: recall from class that i = m(m+1) 2 i=1 Problem 3. [25 points] By...
-
Subprime loans have higher loss rates than many other types of loans. Explain why lenders offer subprime loans. Describe the characteristics of the typical borrower in a subprime consumer loan.
-
Manhattan was allegedly purchased from Native Americans in 1626 for $24. If the sellers had invested this sum at a 6 percent interest rate compounded semiannually, how much would it amount to today?
-
Briefly discuss the Coase theorem. What does this theory imply about the role of government in dealing with market externalities?
-
What is the identification problem? What effect will this problem have on the regression estimates of a demand function? Explain.
-
Continuing to focus on evidence associated with the act, concealment, and conversion, use the evidentiary material to continue the examination. In addition, the examiner also starts to think of terms...
-
Consider the following cash flow profile and assume MARR is 10 percent/year. a. Determine the ERR for this project. b. Is this project economically attractive? EOY 0 2 3 4 5 6 NCF -$100 $15 $15 $15...
-
Quilts R Us (QRU) is considering investing in a new patterning attachment with the cash flow profile shown in the table below. QRU's MARR is 13.5 percent/year. a. What is this investment's external...
Study smarter with the SolutionInn App