

The Heavy Duty Company has just purchased a large machine for a new production process. The machine
Question:
The Heavy Duty Company has just purchased a large machine for a new production process. The machine is powered by a motor that occasionally breaks down and requires a major overhaul. Given the usage of the machine, its manufacturer has provided the company with information about the durability of the motors (the number of days of usage until a breakdown occurs). The information is shown in the following table.
| Day | Probability of a breakdown |
|---|---|
| 1,2,3 | 0 |
| 4 | 0.2 |
| 5 | 0.6 |
| 6 | 0.2 |
| 7 or more | 0 |
The first column lists the number of days the current machine has been in use. For each of these days, the second column then gives the probability that the breakdown will occur on that day. Since these probabilities are 0 except for days 4, 5, and 6, the breakdown always occurs on the fourth, fifth, or sixth day.
Fortunately, the time required to overhaul a motor never exceeds six hours. When this happens, the remainder of the day is used to repair the failed motor so that it will be ready to begin operation again at the beginning of the next day. The average costs incurred during each repair cycle are summarized below.
Cost of a repair cycle that begins with a breakdown
| Lost production during repairing | $5000 |
| Overhaul a motor | $4000 |
| Total | $9000 |
The company is considering a preventive maintenance policy, which would involve scheduling the motor to be removed for an overhaul on a certain day even if a break down has not occurred. The goal is to provide maintenance early enough to prevent a breakdown. Scheduling the overhaul also enables removing and replacing the motor at a convenient time (after production hours) when the machine would not be in use so that no production is lost. An overhaul can be done at the end of day 4 or at the end of day 5 (if a breakdown has not yet occurred) in order to prevent disrupting production in the very near future. The average cost each time this is done is $4,000.
Computer simulation can be used to evaluate and compare the two options (overhaul at the end of day 4 or at the end of day 5). The following is a spreadsheet model for a computer simulation of performing preventive maintenance (repair at the end of day 4). It shows simulations of 100 repair cycles. Numbers in the ``Time until Breakdown (since last maintenance)" column are probabilistic.
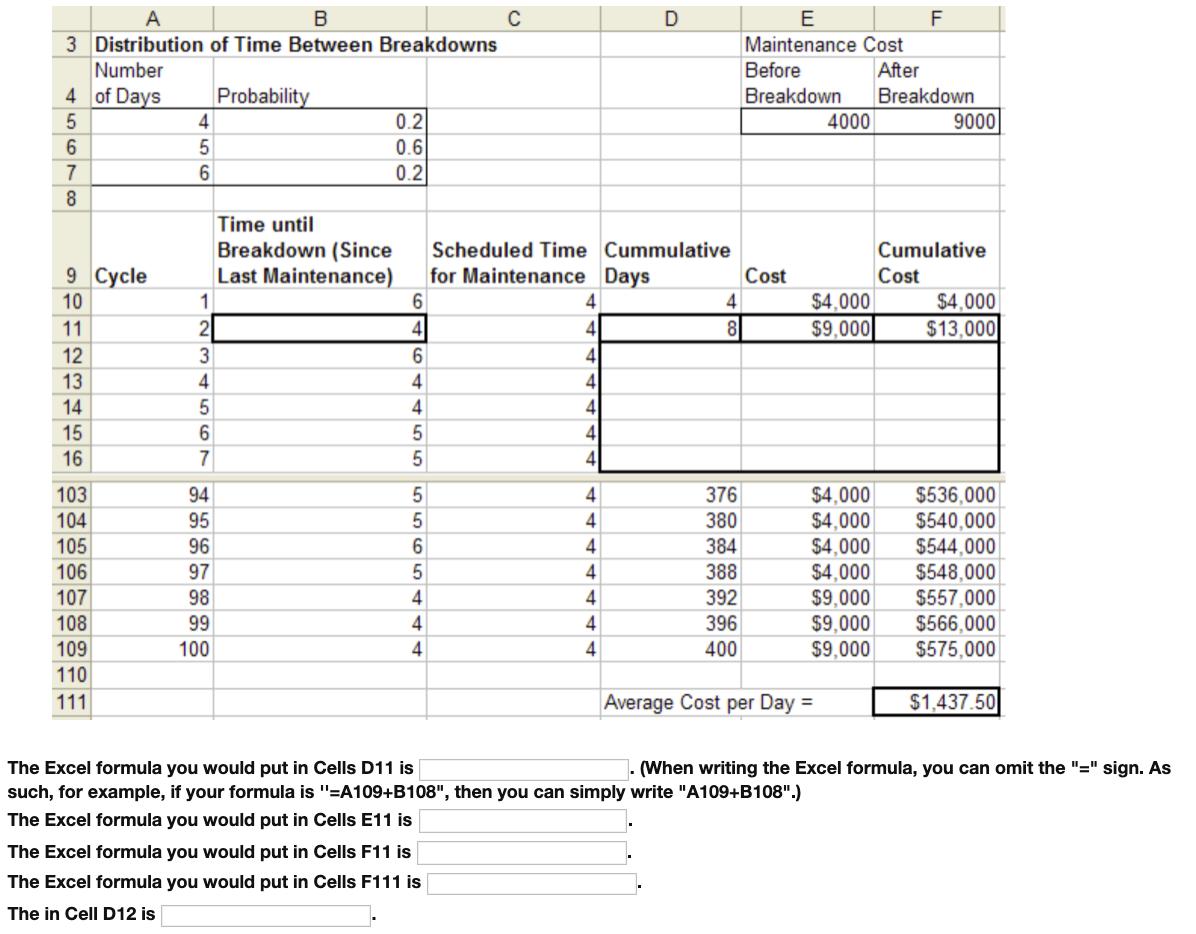 500 trials have been performed to estimate the value in the cell F111 (average cost per day). A statistical summary of the simulation results is presented in the simple table below.
| Statistic | Value |
Trials Mean Median Mode Standard Deviation Variance Skewness Kurtosis Coeff of Variability Range of Minimum Range of Maximum Range Width Mean Std. Error | 500 $1,251.38 $1,250.00 $1,237.50 $49.16 $2,417.01 0.37 3.11 0.04 $1,112.50 $1,425.00 $312.50 $2.20 |
With 99%, the average cost per day is between what two values?
(Use 2.576 as the 99% percentile z-value and round your result to the nearest second decimal. So, for example, if your result is 1312.234, then write 1312.23.)
Expert Answer:


Consumer Behavior Building Marketing Strategy
ISBN: 978-0077645557
12th edition
Authors: Delbert Hawkins, David Mothersbaugh
