

The war in Ukraine has driven many highly qualified IT specialists into neighboring Poland, where many chose
Question:
The war in Ukraine has driven many highly qualified IT specialists into neighboring Poland, where many chose to remain and start looking for jobs
The two attached files (a word document and a PDF file) contain a graphical analysis exercise. The two files are identical, but while you can modify/edit the word document, you cannot change the PDF file.
There are four graphs, depicting: (1) labor market for IT specialists in Poland, (2) the profit maximizing decision of a typical perfectly competitive Polish software firm, (3) market for Polish software products; (4) the Polish market for imported software products. Our goal is to analyze, using what you have learned, the effect of influx of foreign IT specialists on the three markets and on the typicalPolish software firm..
You have to address the questions in order, starting with the labor market for farm workers.
In the labor market for IT specialists::
1. Label clearly the supply and demand curves, S and D. (10%)
2. In the text, indicate clearly what side of the market is affected, supply or demand, by underlining or circling the relevant term. (30%)
3. Once you decided which side of the market is affected and how, show on the graph the new supply or demand curve, labeling them S' or D', and indicate the new equilibrium wage and employment, We' and Ee'. (30%)
5. In the text, fill-in the blank spaces with upward/downward pointing arrows to indicate what happens with equilibrium wage and employment. (30%)
On the graph representing the typical Polish software firm:
- Label the cost functions. (10%)
- In the text, indicate whether the influx of foreign IT specialists affect the firm’s cost functions/demand. (15%)
- Show the effect of the tax on the firm’s cost functions/demand. (15%)
- Indicate the new profit maximizing level of output (q*). (20%)
- In the text, Indicate whether the firm makes a profit/loss. (20%)
- Show the profit/loss on the graph (20%)
In the market for Polish software products and in the Polish market for imported software products:
1. Label clearly the supply and demand curves, S and D. (10%)
2. In the text, indicate clearly what side of the market is affected, supply or demand, by underlining or circling the relevant term. (20%)
3. In the text, indicate clearly by filling in the space provided, the connection between the markets. Why does the change in the price or quantity of one good affect demand or supply of another good (for example, the goods are substitutes in consumption, or one good is an input in the production of the other, etc.) (20%)
4. Once you decided which side of the market is affected and how, show on the graph the new supply or demand curve, labeling them S' or D', and indicate the new equilibrium price and quantity, pe' and qe'. (30%)
5. In the text, fill-in the blank spaces with upward/downward pointing arrows to indicate what happens with equilibrium price and quantity. (20%)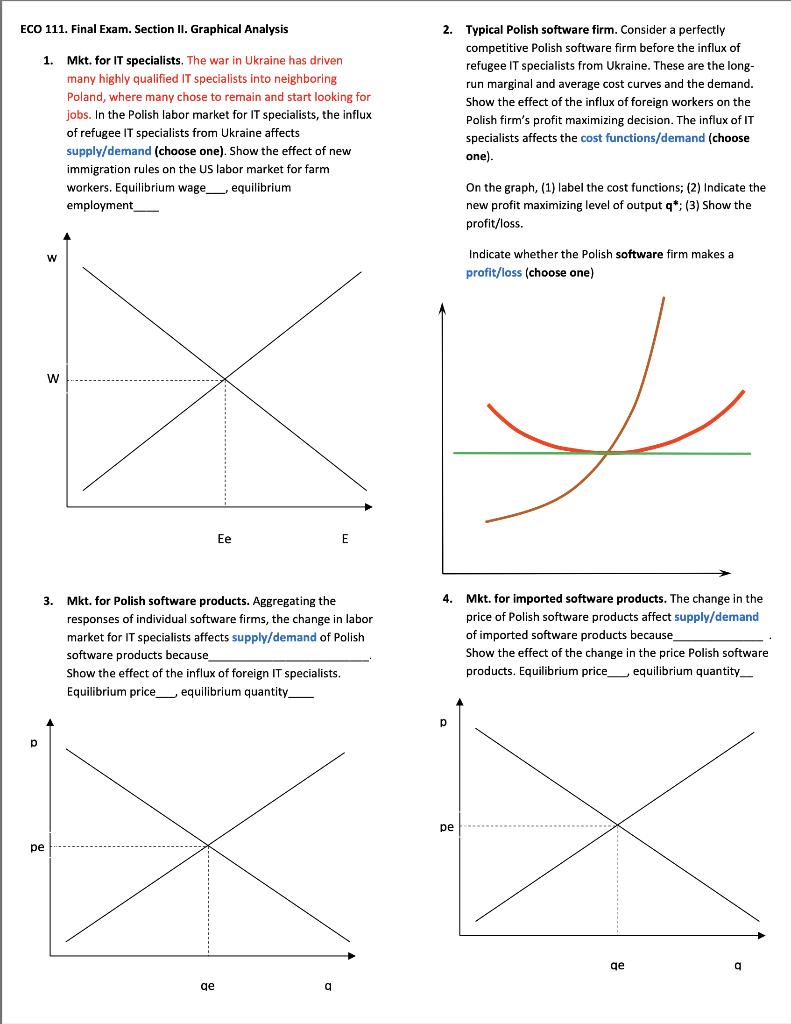
Expert Answer:
Answer 1 Influx of refugee IT specialists from Ukrain affect the supply curv... View the full answer


