

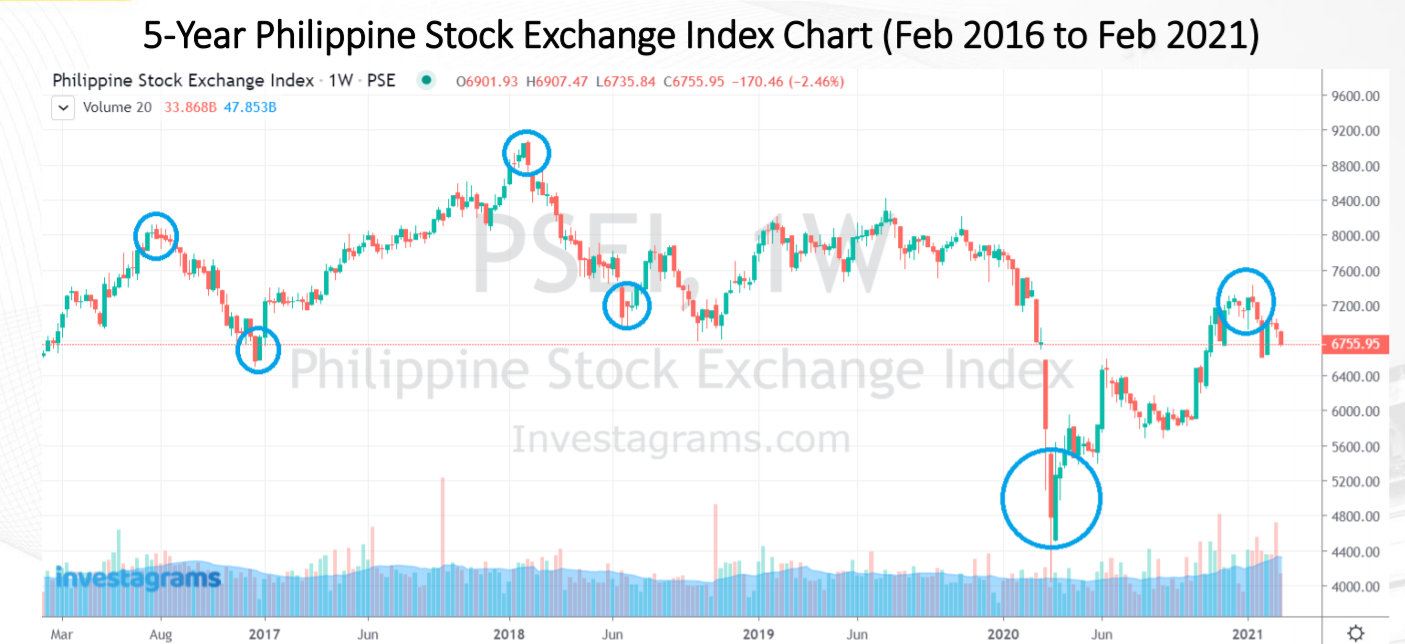
There are six encircled candles in the chart which are the peak and trough of the trend.
Fantastic news! We've Found the answer you've been seeking!
Question:
There are six encircled candles in the chart which are the peak and trough of the trend. Research, enumerate and discuss the events and factors that occur during these period and justify why these have caused the PSEi to increase (peak) or decrease (trough) at a specific level.
For example, in August 2016 (leftmost circle), the PSEi has reached 8,000 from just around 6,500 in March 2016. What are the driving factors that pushed the PSEi to the 8,000 level? Is it because of the new administration or more of improved earnings of the PSEi companies?
Expert Answer:
Here is an analysis of the events and factors during the peak and trough periods indicated in the PS... View the full answer

Related Book For 

Business Statistics A Decision Making Approach
ISBN: 9780133021844
9th Edition
Authors: David F. Groebner, Patrick W. Shannon, Phillip C. Fry
Posted Date:
