

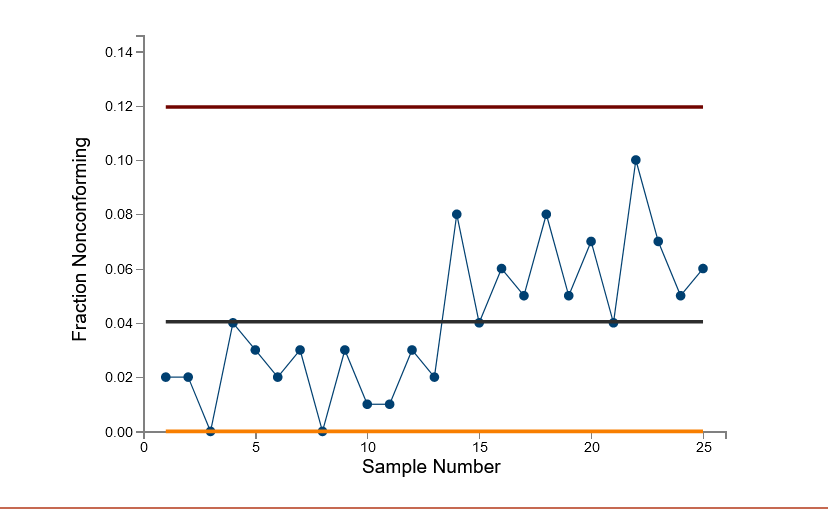
This p-chart shows a process that goes out of control. At about the 12th or 13th sample,
Question:
This p-chart shows a process that goes out of control. At about the 12th or 13th sample, the probability of a non-conforming item more than doubles. Click on the graph to generate a new set of 25 samples of 100 each. Can you see the signs that the process is out of control in the second half of the samples? Sometimes it is difficult.
. In these p-chart examples, which of the following is most accurate?
a. The process is not in control because there are several points that exceed the upper limit line.
b. The process is not in control because the first half of the points are generally below the center line, while the second half are generally above the center line.
c. The process is not in control because the points tend to trend lower from left to right.
d. The process is not in control because several points are less than the lower limit line.
2. In these p-chart examples, which of the following behaviors indicates of a out-of-control process?
a. The points appear to be randomly above and below the center line.
b. Several points in a consecutive sequence are above the center line.
c. Several points exceed the limit lines.
d. The points are trending lower from left to right.
Expert Answer:
Answer Yes you are correct Several points in the second half of the samples exceed ... View the full answer


Business Statistics For Contemporary Decision Making
ISBN: 978-1118749647
8th edition
Authors: Black Ken
