

($ thousands) Sales Cost of goods sold Gross profit Operating expenses Net income ($ thousands) Assets...
Fantastic news! We've Found the answer you've been seeking!
Question:
Transcribed Image Text:
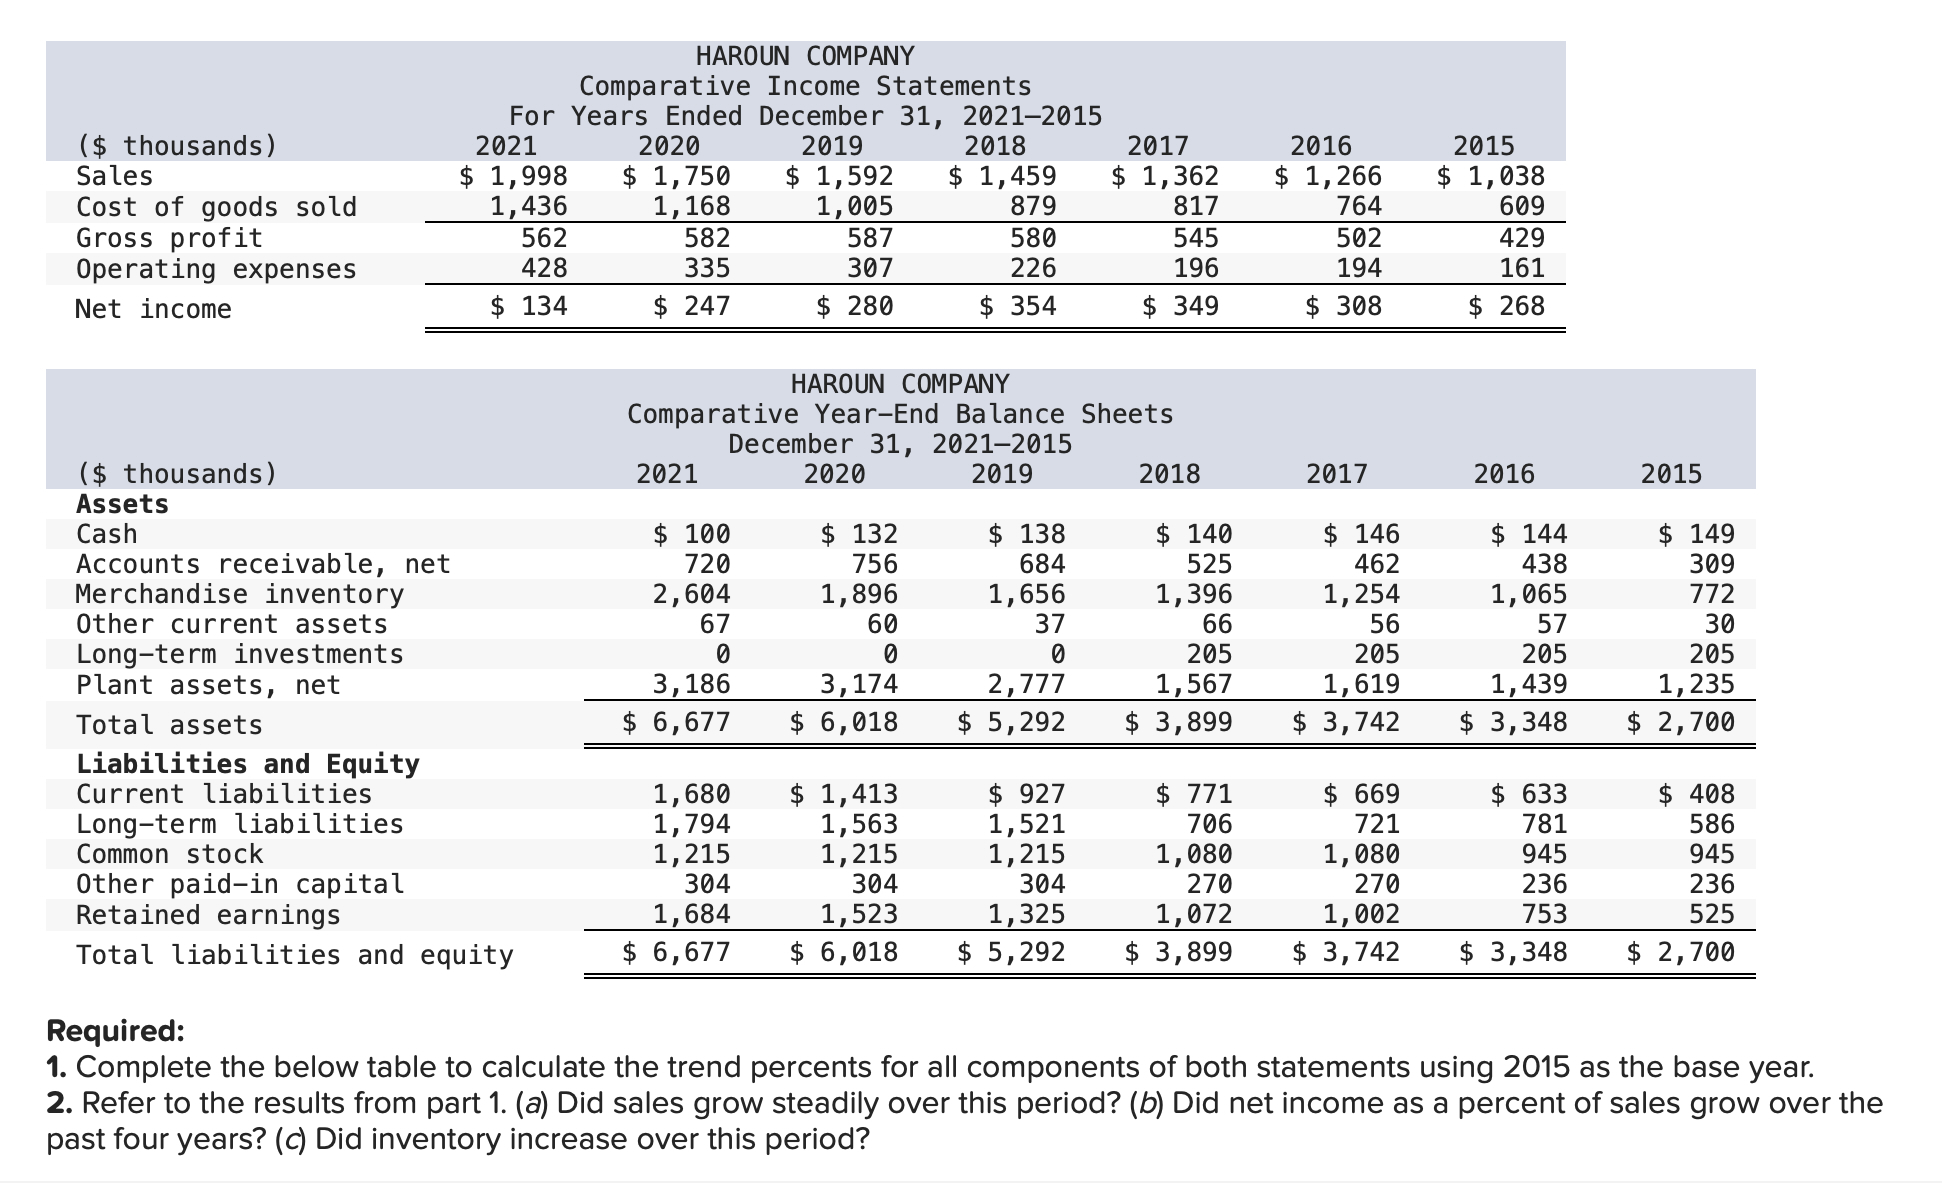
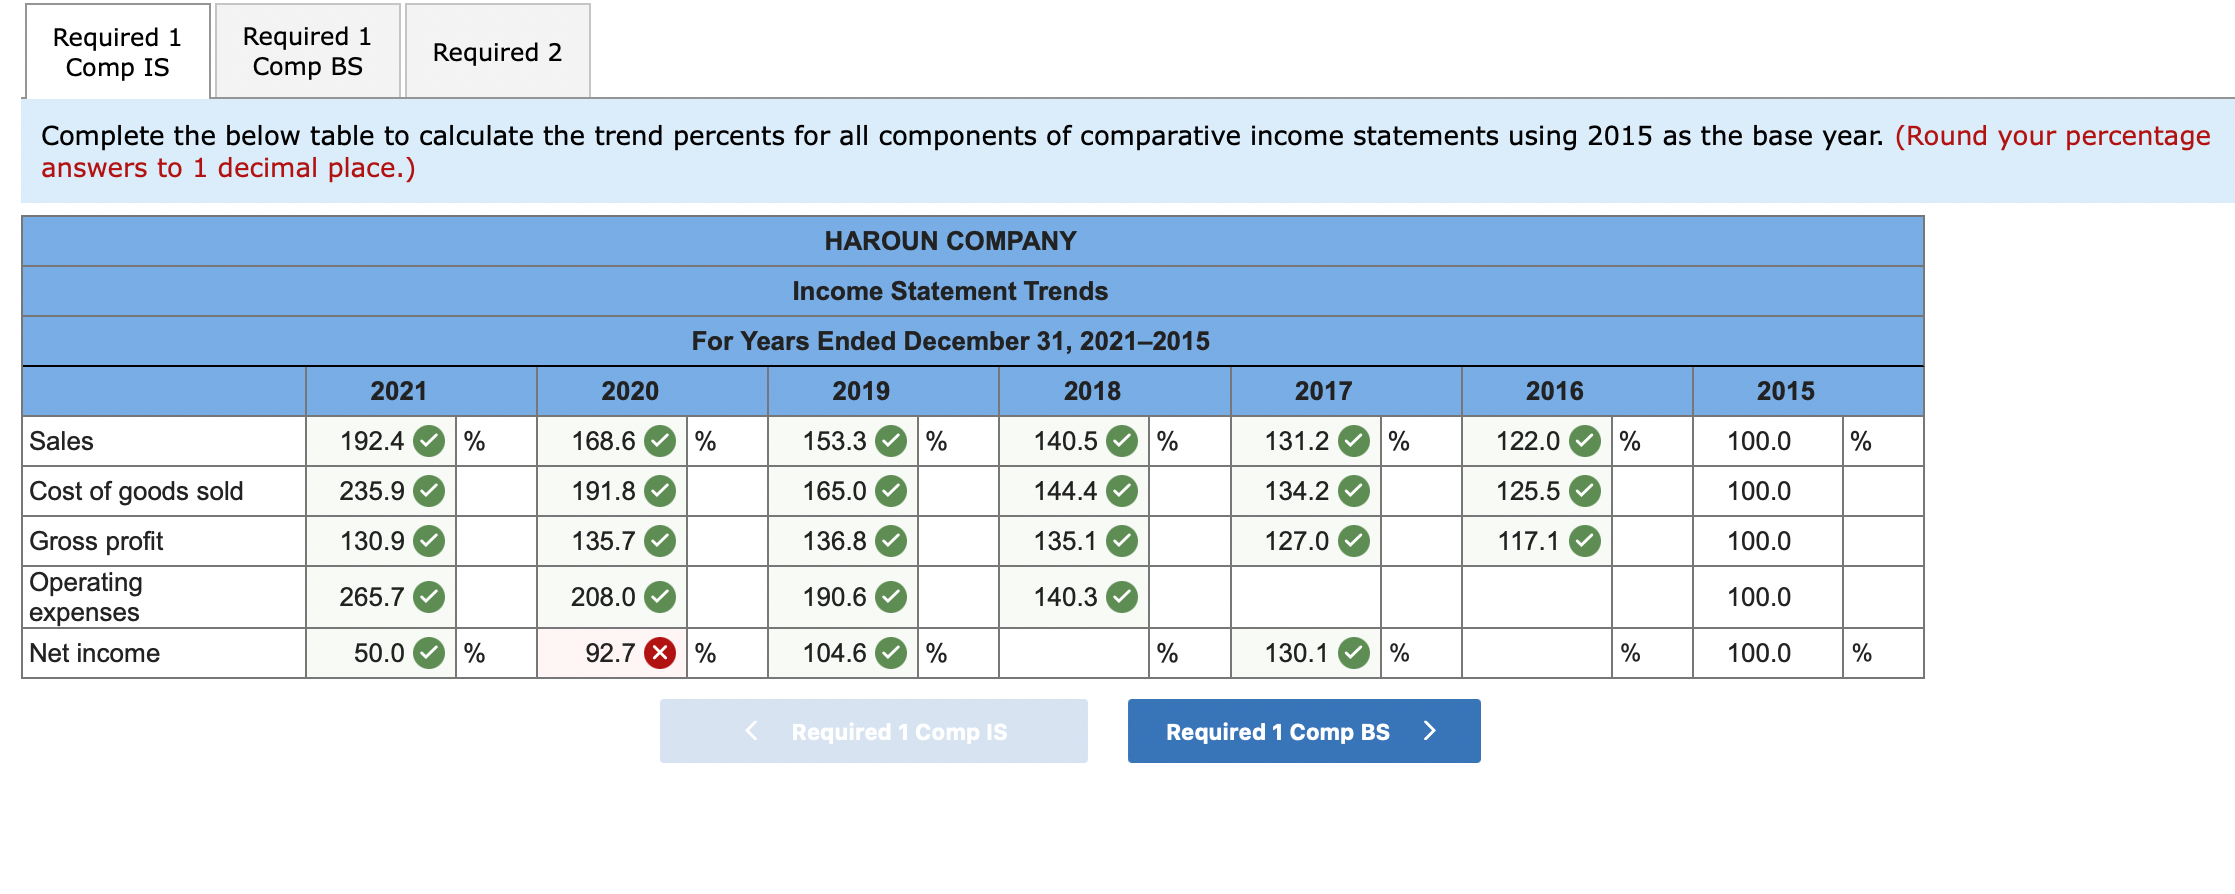
($ thousands) Sales Cost of goods sold Gross profit Operating expenses Net income ($ thousands) Assets Cash Accounts receivable, net Merchandise inventory Other current assets Long-term investments Plant assets, net Total assets HAROUN COMPANY Comparative Income Statements For Years Ended December 31, 2021-2015 2021 $ 1,998 1,436 2019 $ 1,592 1,005 587 307 $ 280 562 428 $ 134 Liabilities and Equity Current liabilities Long-term liabilities Common stock Other paid-in capital Retained earnings Total liabilities and equity 2020 $ 1,750 1,168 582 335 $ 247 2021 HAROUN COMPANY Comparative Year-End Balance Sheets December 31, 2021-2015 2020 2019 $ 100 720 2,604 67 0 3,186 $ 6,677 1,680 1,794 1,215 304 1,684 $ 6,677 2018 $ 1,459 879 580 226 $ 354 $ 132 756 1,896 60 0 3,174 $ 6,018 2017 $ 1,362 817 545 196 $ 349 $ 138 684 1,656 37 0 2,777 $ 5,292 2018 $ 140 525 1,396 66 205 1,567 $ 3,899 $771 706 $ 1,413 $ 927 1,563 1,521 1,215 1,215 1,080 304 304 270 1,523 1,325 1,072 $ 6,018 $ 5,292 $ 3,899 2016 $ 1,266 764 502 194 $ 308 2017 $ 146 462 1,254 56 205 1,619 $ 3,742 $ 669 721 2015 $ 1,038 609 429 161 $268 2016 $ 144 438 1,065 57 205 1,439 $ 3,348 $ 633 781 945 236 753 2015 $ 149 309 772 30 205 1,235 $ 2,700 $ 408 586 1,080 270 1,002 $ 3,742 $ 3,348 $ 2,700 945 236 525 Required: 1. Complete the below table to calculate the trend percents for all components of both statements using 2015 as the base year. 2. Refer to the results from part 1. (a) Did sales grow steadily over this period? (b) Did net income as a percent of sales grow over the past four years? (c) Did inventory increase over this period? Required 1 Comp IS Required 1 Comp BS Complete the below table to calculate the trend percents for all components of comparative income statements using 2015 as the base year. (Round your percentage answers to 1 decimal place.) Sales Cost of goods sold Gross profit Operating expenses Net income 2021 Required 2 192.4 235.9 130.9 265.7 % 50.0 % 2020 168.6 191.8 135.7 208.0 Income Statement Trends For Years Ended December 31, 2021-2015 2019 % 92.7 X % HAROUN COMPANY < 153.3 165.0 136.8 190.6 104.6 % Required 1 Comp IS 2018 140.5 144.4 135.1 140.3 % % 2017 131.2 134.2 127.0 % 130.1 % Required 1 Comp BS > 2016 122.0 125.5 117.1 % % 2015 100.0 100.0 100.0 100.0 100.0 % % ($ thousands) Sales Cost of goods sold Gross profit Operating expenses Net income ($ thousands) Assets Cash Accounts receivable, net Merchandise inventory Other current assets Long-term investments Plant assets, net Total assets HAROUN COMPANY Comparative Income Statements For Years Ended December 31, 2021-2015 2021 $ 1,998 1,436 2019 $ 1,592 1,005 587 307 $ 280 562 428 $ 134 Liabilities and Equity Current liabilities Long-term liabilities Common stock Other paid-in capital Retained earnings Total liabilities and equity 2020 $ 1,750 1,168 582 335 $ 247 2021 HAROUN COMPANY Comparative Year-End Balance Sheets December 31, 2021-2015 2020 2019 $ 100 720 2,604 67 0 3,186 $ 6,677 1,680 1,794 1,215 304 1,684 $ 6,677 2018 $ 1,459 879 580 226 $ 354 $ 132 756 1,896 60 0 3,174 $ 6,018 2017 $ 1,362 817 545 196 $ 349 $ 138 684 1,656 37 0 2,777 $ 5,292 2018 $ 140 525 1,396 66 205 1,567 $ 3,899 $771 706 $ 1,413 $ 927 1,563 1,521 1,215 1,215 1,080 304 304 270 1,523 1,325 1,072 $ 6,018 $ 5,292 $ 3,899 2016 $ 1,266 764 502 194 $ 308 2017 $ 146 462 1,254 56 205 1,619 $ 3,742 $ 669 721 2015 $ 1,038 609 429 161 $268 2016 $ 144 438 1,065 57 205 1,439 $ 3,348 $ 633 781 945 236 753 2015 $ 149 309 772 30 205 1,235 $ 2,700 $ 408 586 1,080 270 1,002 $ 3,742 $ 3,348 $ 2,700 945 236 525 Required: 1. Complete the below table to calculate the trend percents for all components of both statements using 2015 as the base year. 2. Refer to the results from part 1. (a) Did sales grow steadily over this period? (b) Did net income as a percent of sales grow over the past four years? (c) Did inventory increase over this period? ($ thousands) Sales Cost of goods sold Gross profit Operating expenses Net income ($ thousands) Assets Cash Accounts receivable, net Merchandise inventory Other current assets Long-term investments Plant assets, net Total assets HAROUN COMPANY Comparative Income Statements For Years Ended December 31, 2021-2015 2021 $ 1,998 1,436 2019 $ 1,592 1,005 587 307 $ 280 562 428 $ 134 Liabilities and Equity Current liabilities Long-term liabilities Common stock Other paid-in capital Retained earnings Total liabilities and equity 2020 $ 1,750 1,168 582 335 $ 247 2021 HAROUN COMPANY Comparative Year-End Balance Sheets December 31, 2021-2015 2020 2019 $ 100 720 2,604 67 0 3,186 $ 6,677 1,680 1,794 1,215 304 1,684 $ 6,677 2018 $ 1,459 879 580 226 $ 354 $ 132 756 1,896 60 0 3,174 $ 6,018 2017 $ 1,362 817 545 196 $ 349 $ 138 684 1,656 37 0 2,777 $ 5,292 2018 $ 140 525 1,396 66 205 1,567 $ 3,899 $771 706 $ 1,413 $ 927 1,563 1,521 1,215 1,215 1,080 304 304 270 1,523 1,325 1,072 $ 6,018 $ 5,292 $ 3,899 2016 $ 1,266 764 502 194 $ 308 2017 $ 146 462 1,254 56 205 1,619 $ 3,742 $ 669 721 2015 $ 1,038 609 429 161 $268 2016 $ 144 438 1,065 57 205 1,439 $ 3,348 $ 633 781 945 236 753 2015 $ 149 309 772 30 205 1,235 $ 2,700 $ 408 586 1,080 270 1,002 $ 3,742 $ 3,348 $ 2,700 945 236 525 Required: 1. Complete the below table to calculate the trend percents for all components of both statements using 2015 as the base year. 2. Refer to the results from part 1. (a) Did sales grow steadily over this period? (b) Did net income as a percent of sales grow over the past four years? (c) Did inventory increase over this period? Required 1 Comp IS Required 1 Comp BS Complete the below table to calculate the trend percents for all components of comparative income statements using 2015 as the base year. (Round your percentage answers to 1 decimal place.) Sales Cost of goods sold Gross profit Operating expenses Net income 2021 Required 2 192.4 235.9 130.9 265.7 % 50.0 % 2020 168.6 191.8 135.7 208.0 Income Statement Trends For Years Ended December 31, 2021-2015 2019 % 92.7 X % HAROUN COMPANY < 153.3 165.0 136.8 190.6 104.6 % Required 1 Comp IS 2018 140.5 144.4 135.1 140.3 % % 2017 131.2 134.2 127.0 % 130.1 % Required 1 Comp BS > 2016 122.0 125.5 117.1 % % 2015 100.0 100.0 100.0 100.0 100.0 % % Required 1 Comp IS Required 1 Comp BS Complete the below table to calculate the trend percents for all components of comparative income statements using 2015 as the base year. (Round your percentage answers to 1 decimal place.) Sales Cost of goods sold Gross profit Operating expenses Net income 2021 Required 2 192.4 235.9 130.9 265.7 % 50.0 % 2020 168.6 191.8 135.7 208.0 Income Statement Trends For Years Ended December 31, 2021-2015 2019 % 92.7 X % HAROUN COMPANY < 153.3 165.0 136.8 190.6 104.6 % Required 1 Comp IS 2018 140.5 144.4 135.1 140.3 % % 2017 131.2 134.2 127.0 % 130.1 % Required 1 Comp BS > 2016 122.0 125.5 117.1 % % 2015 100.0 100.0 100.0 100.0 100.0 % %
Expert Answer:
Answer rating: 100% (QA)
ANSWER Trend Percent Calculation Table Income Statement Year Sales Cost of goods sol... View the full answer

Related Book For 
Fundamental Accounting Principles
ISBN: 978-0078110870
20th Edition
Authors: John J. Wild, Ken W. Shaw, Barbara Chiappetta
Posted Date:
Students also viewed these accounting questions
-
Problem 13-1A Calculation and analysis of trend percents LO A1, P1 Selected comparative financial statements of Haroun Company follow. HAROUN COMPANY Comparative Income Statements For Years Ended...
-
Selected comparative financial statements of Haroun Company follow. Required 1. Compute trend percents for all components of both statements using 2011 as the base year. (Round percents to one...
-
Comparative income statements for Berg Company are given as follows: Required Prepare horizontal and vertical analyses of Berg's income statement data and comment on the current status of the...
-
Arvind runs a small electronics company in India and has just sold some equipment to a U.S. company for $1 million to be paid in 90 days. His cost in Indian Rupees (INR) is 60 million. The current...
-
What is the angular speed of a car traveling at 50 km/h and rounding a circular turn of radius 110 m?
-
Rework problem 12.19 except assume that the limit outputs are subject to the following inequality constraints: \[\begin{aligned}& 200 \leq \mathrm{P}_{1} \leq 800 \mathrm{MW} \\& 100...
-
Presented below are selected financial data from the 2015 annual report of The Boeing Company: Required Using the ratio definitions from Exhibit 4.6, calculate the financial ratios for The Boeing...
-
Kuznicki made a contract for the installation of a fire detection system by Security Safety Corp. for $498. The contract was made one night and canceled at 9:00 the next morning. Security then...
-
Consider the following American put. Underlying stock price = $ 8 0 Exercise price = $ 8 1 Standard deviation = 4 0 % Time to maturity = 6 months Risk - free rate = 6 % Using the two - step binomial...
-
Insert a PivotChart using the Pie chart type based on the data. Place the upper-left corner of the chart inside cell I22. Format the Legend of the chart to appear at the bottom of the chart area....
-
Who proposed the hypothesis that life must have developed from the simple inorganic molecules which were present on earth soon after it was formed? (A) Miller (B) Urey (C) Darwin (D) Haldane
-
Edman Company is a merchandiser that has provided the following balance sheet and income statement for this year. Beginning Balance Ending Balance Assets Cash $ 62,800 $ 150,000 Accounts receivable...
-
This week, we examined the importance of communication systems (both informal and formal) to effective leadership and the role of organizational culture. Address the following: Select a manager and...
-
A rectangular swimming pool is 19 meters long, 14(1)/(2) meters wide, and 1(1)/(2) meters deep. What is its volume? The volume is cubic meters.
-
State All the answers that are CORRECT. There will be no deduction for gift for YR1 and YR2 The loss available for offset against YR 3 profit will be $4000 The loss available for offset against YR 3...
-
A leaky bucket picks up 20 litres of water from a well but drips out 1 litre every second from the bottom. If the bucket was lifted 5 metres from the surface of the water at a constant speed of 2...
-
Working capital = Current assets - current liabilities= 2,790,000 Working capital Current Ratio current = assets/current liabilities = 4.1 Accounts receivable turnover = sales/acc receivable =...
-
Prairie Outfitters, Inc., a retailer, accepts paymnent through credit cards. During August, credit card sales amounted to $12,000. The processor charges a 3% fee. Assuming that the credit card...
-
NixIt Companys ledger on July 31, its fiscal year-end, includes the following selected accounts that have normal balances (NixIt uses the perpetual inventory system) A physical count of its July 31...
-
Ming Yue Company pays $368,250 for real estate plus $19,600 in closing costs. The real estate consists of land appraised at $166,320; land improvements appraised at $55,440; and a building appraised...
-
Take a step back in time and imagine Research In Motion in its infancy as a company. The year is 1984. Required 1. Read the history of Research In Motion at www.RIM.com. Identify the two partners...
-
What is the case for efficiency and productivity?
-
Do earnings differences reflect discrimination or differences in productivity?
-
How many people live in poverty?

Study smarter with the SolutionInn App