

Draw a line chart of the electoral systemturnout relationship, controlling for per capita GDP. Enhance the readability
Fantastic news! We've Found the answer you've been seeking!
Question:
- Draw a line chart of the electoral system−turnout relationship, controlling for per capita GDP.
- Enhance the readability of the chart by making 55 percent the lowest vertical axis value and 70 percent the highest vertical axis value.
In this exercise you will test a hypothesis that electoral systems affect turnout: In a comparison of countries, countries with PR systems will have higher turnouts than will countries that do not have PR systems. Level of economic development is an important control variable, because development, measured as gross domestic product (GDP) per capita, is known to be an alternative cause of voter participation. Therefore, evaluate the electoral system−turnout relationship, controlling for per capita GDP.
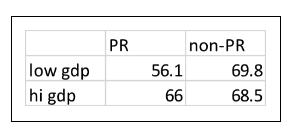
Among countries with low per capita GDP, the mean levels of turnout are as follows:
- non-PR countries, 56.1 percent.
- PR countries, 69.8 percent.
- For all low per capita GDP countries, 61.6 percent.
Among countries with high GDP per capita:
- non-PR countries, 66.0 percent.
- PR countries, 68.5 percent.
- For all high per capita GDP countries, 67.4 percent.
Among all countries:
- non-PR countries averaged 63.1 percent,
- and PR countries averaged 68.7 percent.
- The overall mean, for all countries: 66.0 percent.
Expert Answer:
For a nation GDP is the total value of all completed products and services produced inside that coun... View the full answer

Related Book For 

Project Management A Managerial Approach
ISBN: 978-0470533024
8th edition
Authors: Jack R. Meredith, Samuel J. Mantel Jr.
Posted Date:
