

Trends in stock price, dividends and stockholders equity? Pick a time frame (ie last 3 years). State
Question:
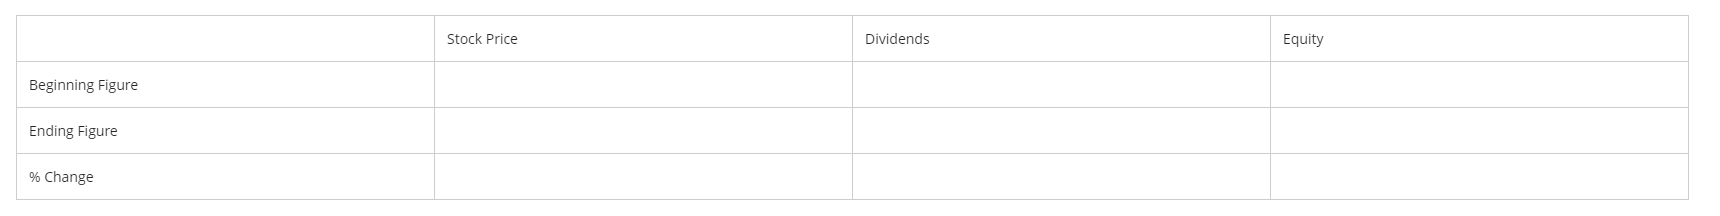
Trends in stock price, dividends and stockholders equity? Pick a time frame (ie last 3 years). State the beginning figures, ending figures, % change and the reason for trend over that time period for EACH indicator (stock price, dividends and stockholders equity). Use the historical tab for the stock price and dividends (try to use as close to year-end dates as possible). For stockholder's equity, click the Financials tab, the blue Balance Sheet link and the Total Equity Gross Minority arrow. This will open up your stockholder's equity figures. Make sure to add 3 zeros to the equity figures or include a statement that they are posted "in thousands". To calculate % change = (End Figure-Beg Figure)/Beg Figure. As an example, you may include the following chart on the slide and then include the actual discussion within the notes.
Expert Answer:


Income Tax Fundamentals 2013
ISBN: 9781285586618
31st Edition
Authors: Gerald E. Whittenburg, Martha Altus Buller, Steven L Gill
