

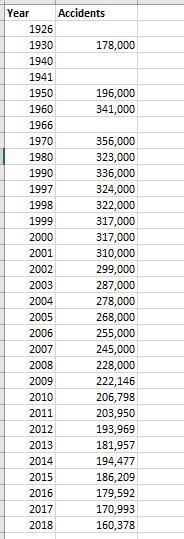
a. Plot the Year vs Accidents. b. You should notice an obvious pattern in the data, choose
Fantastic news! We've Found the answer you've been seeking!
Question:
a. Plot the Year ‘vs’ Accidents.
b. You should notice an obvious pattern in the data, choose a new starting year and replot Year ‘vs’ Accidents.
c. Fit a trendline to the accident data, Hint. Start the first year (e.g. 2000) at 1, second year at 2. This will give you a nicer equation to deal with.
d . Use the equation of the trendline to predict the accidents for the range 2019-2040
e. Does this make sense? What does it tell you about the trendline? Consider when you should be careful about making predictions.
Expert Answer:

Related Book For 

Posted Date:
