

U.S. Civilian Labor Force, 2007-2016 Year Labor Force 2007 153,918 2008 154,655 2009 153,111 2010 153,650 2011
Fantastic news! We've Found the answer you've been seeking!
Question:
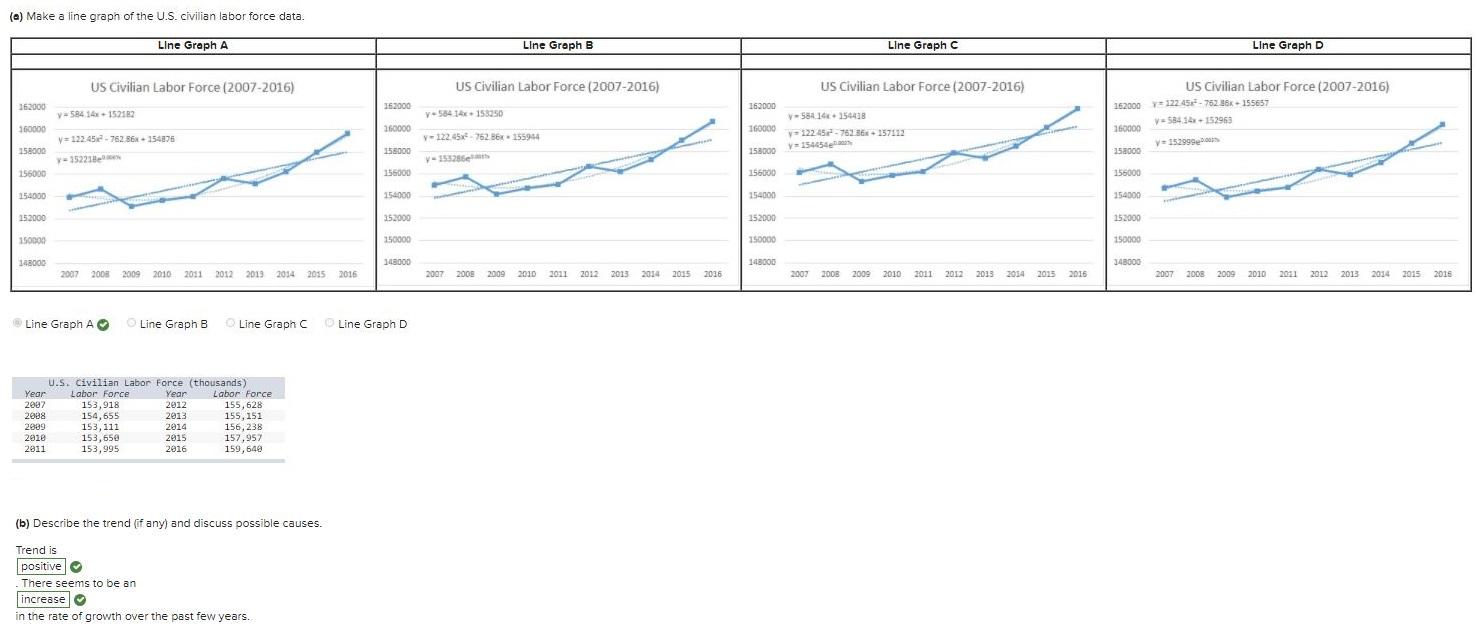
| U.S. Civilian Labor Force, 2007-2016 | ||||||
| Year | Labor Force | |||||
| 2007 | 153,918 | |||||
| 2008 | 154,655 | |||||
| 2009 | 153,111 | |||||
| 2010 | 153,650 | |||||
| 2011 | 153,995 | |||||
| 2012 | 155,628 | |||||
| 2013 | 155,151 | |||||
| 2014 | 156,238 | |||||
| 2015 | 157,957 | |||||
| 2016 | 159,640 | |||||
Expert Answer:

Related Book For 
The Essentials of Statistics A Tool for Social Research
ISBN: 978-1111829568
3rd edition
Authors: Joseph F. Healey
Posted Date:
