

Use a table of cumulative areas under the normal curve to find the z-score that corresponds...
Fantastic news! We've Found the answer you've been seeking!
Question:
Transcribed Image Text:
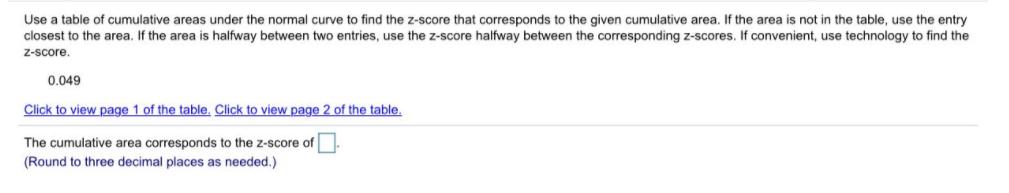
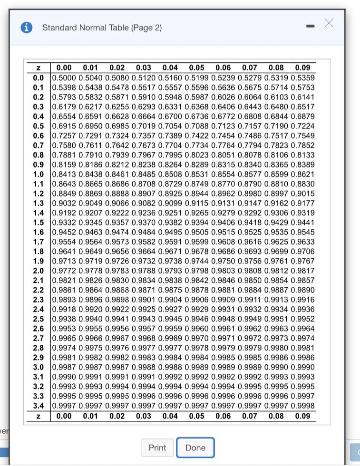
Use a table of cumulative areas under the normal curve to find the z-score that corresponds to the given cumulative area. If the area is not in the table, use the entry closest to the area. If the area is halfway between two entries, use the z-score halfway between the corresponding z-scores. If convenient, use technology to find the Z-score. 0.049 Click to view page 1 of the table. Click to view page 2 of the table. The cumulative area corresponds to the z-score of (Round to three decimal places as needed.) O Standard Normal Table Page 2) 0.01 0.02 0.08 0.03 0.04 0.05 0.0 0.5000 0 5040 0.5080 0 5120 0.5160 0.5198 0.5239 0.5278 0.5319 0.5359 0.1 0.5398 0.5438 0,5478 0.5617 0.5557 0.5598 0.6636 0.5675 0.5714 0.5753 0.2 0.5793 0.5832 0.5871 0.5910 0.5948 0.5987 0.6026 0.8064 0.6103 0.8141 0.3 0.6179 0 6217 0.6255 0.6293 0.6331 0.6368 0.6406 0.6443 0.6480 0.6517 0.4 0.8554 0.8591 0.6628 0.8664 0.6700 0.8736 0.6772 0.6808 0.6944 0.8879 0.5 0.6915 0.6950 0.6985 0.7019 0.7054 0.7088 0.7123 0.7157 0.7190 0.7224 0.6 0.7257 0.7291 0.7324 0.7357 0.7389 0.7422 0.7454 0.7486 0.7517 0.7549 0.7 0.7580 0.7611 0.7842 0.7673 0.7704 0.7734 0.7784 0.7794 0.7823 0.7852 0.8 0.7881 0.7910 0.7939 0.7967 0.7995 0.B023 0.8051 0.8078 0.8106 0.8133 0.9 0.8159 0818i 0.8212 08238 0.8264 0.8289 0.831s 0.8340 0.8365 0.8389 1.0 0.8413 0.8438 0.8481 0.8485 0.8508 0.8531 0.8554 0.8577 0.8599 0.8621 1.1 0.8643 0.865 0.8686 0.8708 0.8729 0.8748 0.877o 0.8790 0.8810 0.8830 1.2 0.8849 D 8869 0.8888 0.9907 0.8925 0.8944 0.8962 0.4980 0.8997 0.9015 1.3 0.9032 0.9049 0.9086 0.9082 0.9099 0.9115 0.9131 0.9147 0.9162 0.9177 1.4 0.9192 0.9207 0.9222 0.9236 0.9251 0.9265 0.9279 0.9292 0.9306 0.8319 1.5 0.9332 0.9345 0.9357 0.9370 0.9382 0.9394 0.94c6 0.9418 0.9429 0.9441 1.6 0.9452 0.9463 0.9474 0.9484 0.9495 0.9505 0.9515 0.95s25 0,9535 0.9545 1.7 0.9554 D 9564 0.9573 0.9582 0.9591 0.9599 0.9508 0.9616 0.9525 0.9633 1.8 0.9641 0.9649 0.9656 0.9664 0.9671 0.9678 0.9686 0.9693 0.9699 0.9706 1.9 0.9713 0.9719 0.9726 0.9732 0.9738 0.9744 0.9750 0.9756 0.9761 0.9767 2.0 0.9772 0.9778 0.9783 09788 0.9793 0.9798 0.9803 0.9808 0.9812 0.9817 2.1 J0.9821 0.9826 0.9830 0.9834 0.9038 0.9842 0.9846 0.9850 0.9954 0.9857 2.2 0.5861 0.9864 0.9868 0.9871 0.9875 0.8878 0.9881 0.9884 0.9887 0.9890 2.3 0.9893 0.9896 0,9898 0.9901 0.9904 0.9906 0.9909 0.9911 0.9913 0.9916 2.4 0.9918 0.9920 0.9922 0.9925 0.9927 0.9829 0.9931 0.9932 0.9934 0.9936 2.5 0.9938 0.9540 0.9941 0.9943 0.9945 0.9946 0.9948 0.9949 0.9951 0.9952 2.6 0.9953 0.9955 0,9956 0.9957 0.9959 0.9660 0.9961 0.9962 0.9963 0.9964 2.7 0.9985 0.966 0,9987 0.9968 0.9989 0,9970 0.9971 0.9972 0.9973 0.9974 2.8 0.5974 0.9875 0.9976 0.9977 0.9977 0.8978 0.9979 0.8979 0.9980 0.B981 2.9 0.9981 0.982 0.9982 0.9983 0.9984 0.9884 0.9985 0.9985 0.9986 0.9ea6 3.0 0.9987 0.9887 0.9987 0.9988 0.9988 0.9989 0.9989 0.9989 0.9990 0.9990 3.1 0.5980 0.9591 0.9991 0.9991 0.9982 0.9992 0.9952 0.9992 0.9993 0.9993 3.2 a.9993 0.9993 0.9994 0.9994 0.9994 0.9994 0.9994 0.9995 0.9995 0.9995 3.3 0.9995 0.995 0.9995 0.9998 0.9996 0.9996 0.9996 0.9996 0.9996 0.9997 3.4 0.9997 09597 0.9997 0.9997 0.9997 0.9997 0.9997 0,9997 0.9997 0.5998 0.01 0.02 0.03 0.04 0.05 0.06 0.07 0.08 0.09 0.00 0.06 0.07 0.09 0.00 er Print Dore Use a table of cumulative areas under the normal curve to find the z-score that corresponds to the given cumulative area. If the area is not in the table, use the entry closest to the area. If the area is halfway between two entries, use the z-score halfway between the corresponding z-scores. If convenient, use technology to find the Z-score. 0.049 Click to view page 1 of the table. Click to view page 2 of the table. The cumulative area corresponds to the z-score of (Round to three decimal places as needed.) O Standard Normal Table Page 2) 0.01 0.02 0.08 0.03 0.04 0.05 0.0 0.5000 0 5040 0.5080 0 5120 0.5160 0.5198 0.5239 0.5278 0.5319 0.5359 0.1 0.5398 0.5438 0,5478 0.5617 0.5557 0.5598 0.6636 0.5675 0.5714 0.5753 0.2 0.5793 0.5832 0.5871 0.5910 0.5948 0.5987 0.6026 0.8064 0.6103 0.8141 0.3 0.6179 0 6217 0.6255 0.6293 0.6331 0.6368 0.6406 0.6443 0.6480 0.6517 0.4 0.8554 0.8591 0.6628 0.8664 0.6700 0.8736 0.6772 0.6808 0.6944 0.8879 0.5 0.6915 0.6950 0.6985 0.7019 0.7054 0.7088 0.7123 0.7157 0.7190 0.7224 0.6 0.7257 0.7291 0.7324 0.7357 0.7389 0.7422 0.7454 0.7486 0.7517 0.7549 0.7 0.7580 0.7611 0.7842 0.7673 0.7704 0.7734 0.7784 0.7794 0.7823 0.7852 0.8 0.7881 0.7910 0.7939 0.7967 0.7995 0.B023 0.8051 0.8078 0.8106 0.8133 0.9 0.8159 0818i 0.8212 08238 0.8264 0.8289 0.831s 0.8340 0.8365 0.8389 1.0 0.8413 0.8438 0.8481 0.8485 0.8508 0.8531 0.8554 0.8577 0.8599 0.8621 1.1 0.8643 0.865 0.8686 0.8708 0.8729 0.8748 0.877o 0.8790 0.8810 0.8830 1.2 0.8849 D 8869 0.8888 0.9907 0.8925 0.8944 0.8962 0.4980 0.8997 0.9015 1.3 0.9032 0.9049 0.9086 0.9082 0.9099 0.9115 0.9131 0.9147 0.9162 0.9177 1.4 0.9192 0.9207 0.9222 0.9236 0.9251 0.9265 0.9279 0.9292 0.9306 0.8319 1.5 0.9332 0.9345 0.9357 0.9370 0.9382 0.9394 0.94c6 0.9418 0.9429 0.9441 1.6 0.9452 0.9463 0.9474 0.9484 0.9495 0.9505 0.9515 0.95s25 0,9535 0.9545 1.7 0.9554 D 9564 0.9573 0.9582 0.9591 0.9599 0.9508 0.9616 0.9525 0.9633 1.8 0.9641 0.9649 0.9656 0.9664 0.9671 0.9678 0.9686 0.9693 0.9699 0.9706 1.9 0.9713 0.9719 0.9726 0.9732 0.9738 0.9744 0.9750 0.9756 0.9761 0.9767 2.0 0.9772 0.9778 0.9783 09788 0.9793 0.9798 0.9803 0.9808 0.9812 0.9817 2.1 J0.9821 0.9826 0.9830 0.9834 0.9038 0.9842 0.9846 0.9850 0.9954 0.9857 2.2 0.5861 0.9864 0.9868 0.9871 0.9875 0.8878 0.9881 0.9884 0.9887 0.9890 2.3 0.9893 0.9896 0,9898 0.9901 0.9904 0.9906 0.9909 0.9911 0.9913 0.9916 2.4 0.9918 0.9920 0.9922 0.9925 0.9927 0.9829 0.9931 0.9932 0.9934 0.9936 2.5 0.9938 0.9540 0.9941 0.9943 0.9945 0.9946 0.9948 0.9949 0.9951 0.9952 2.6 0.9953 0.9955 0,9956 0.9957 0.9959 0.9660 0.9961 0.9962 0.9963 0.9964 2.7 0.9985 0.966 0,9987 0.9968 0.9989 0,9970 0.9971 0.9972 0.9973 0.9974 2.8 0.5974 0.9875 0.9976 0.9977 0.9977 0.8978 0.9979 0.8979 0.9980 0.B981 2.9 0.9981 0.982 0.9982 0.9983 0.9984 0.9884 0.9985 0.9985 0.9986 0.9ea6 3.0 0.9987 0.9887 0.9987 0.9988 0.9988 0.9989 0.9989 0.9989 0.9990 0.9990 3.1 0.5980 0.9591 0.9991 0.9991 0.9982 0.9992 0.9952 0.9992 0.9993 0.9993 3.2 a.9993 0.9993 0.9994 0.9994 0.9994 0.9994 0.9994 0.9995 0.9995 0.9995 3.3 0.9995 0.995 0.9995 0.9998 0.9996 0.9996 0.9996 0.9996 0.9996 0.9997 3.4 0.9997 09597 0.9997 0.9997 0.9997 0.9997 0.9997 0,9997 0.9997 0.5998 0.01 0.02 0.03 0.04 0.05 0.06 0.07 0.08 0.09 0.00 0.06 0.07 0.09 0.00 er Print Dore
Expert Answer:

Related Book For 

Elementary Statistics
ISBN: 978-0538733502
11th edition
Authors: Robert R. Johnson, Patricia J. Kuby
Posted Date:
Students also viewed these mathematics questions
-
Find the area under the normal curve up to z = 0.36; that is, find P(Z 0.36). Interpret this value?
-
Find the area under the normal curve that lies between the following pairs of z-values: a. z = -3.00 and z = 3.00 b. z(0.975) and z(0.025) c. z(o.io) and z(o.oi)
-
Find the area under the normal curve that lies between the following pairs of z-values: a. z = 1.20 to z = 0.22 b. z = 1.75 to z = 1.54 c. z = 1.30 to z = 2.58 d. z = 0.35 to z = 3.50
-
Sienna has experienced a couple of profitable months and has over $20,600 in disposable income, however she is thinking that she should replace a few of her high-end blenders for the smoothie bar....
-
A friend calculates a variance and reports that it is 25.0. How do you know that he has made a serious calculation error?
-
A wooden block of mass M resting on a frictionless horizontal surface is attached to a rigid rod of length θ and of negligible mass (Fig. P11.35) The rod is pivoted at the other end. A bullet...
-
The following TI-84 Plus display presents the results of a test of the null hypothesis H0: 1 = 0. a. What is the alternate hypothesis? b. What is the value of the test statistic? c. How many degrees...
-
In an article in Barrons on April 21, 2008, a commentator remarked, "As one of the world's largest makers of bathroom tissue and baby diapers, Kimberly-Clark knows a thing or two about bottoms....
-
Factor Company is planning to add a new product to its line. To manufacture this product, the company needs to buy a new machine at a $503,000 cost with an expected four-year life and a $20,000...
-
Casey Morgan is a single taxpayer, social security number 412-34-5670, who lives at 582 Brockton Lane, Columbus, OH 43081. Casey has income from a job as a manager, interest and dividend income, and...
-
Calculate ROIC for a hypothetical firm using the following financial accouting information: Current Assets: $300 million Value of Intellectual Property: $20 million Current Liabilities: $250 million...
-
Describe the shape of this distribution. 7 88 6 5 4 3 2 1 0 3 4 5 6 7
-
In a credit sales and cash receipts system flowchart symbol X could represent a. Auditors test data. b. Remittance advices from customers. c. Error reports. d. Credit authorization forms.
-
. . Chapter 6 in CMH discusses impact assessments as part the change assessment process. Look at the discussion on high-level impact assessments. What would you add to this? What section could be...
-
Find and classify the stationary values of the function f(x, y) = sin x cos y + 2 cos x sin y in the range 0xm, x y 0syn. fxy 2 fxxfyy-fxy Type f(x,y)
-
Go to www.mississippi.com Once there, seek out the category that gives you information on county and local statistics. Select Lauderdale county to obtain the vital demographic and socioeconomic data...
-
Explain how you would calculate an exercise pulse rate if you used a stopwatch to time 2 0 consecutive beats.
-
Annual dividends of ATTA Corp grew from $0.96 in 2005 to $1.76 in 2017. What was the annual growth rate?
-
If P (A) = 0.4, P(B) = 0.9 and P(A and B) =0.1, Find P(A or B).
-
According to ACT, results from the 2008 ACT test-ing found that students had a mean reading score of 21.4 with a standard deviation of 6.0. Assuming that the scores are normally distributed, a. find...
-
An unmarried 19-year-old who has just purchased his/her own 2-year-old Honda Civic might be asking,Why does auto insurance cost so much?There are many reasons, according to the insurance agent, one...
-
Why are provisions a problem?
-
Who are the main users of financial accounting information, and what are their information needs?
-
Why do we not have pure historic cost accounting?

Study smarter with the SolutionInn App