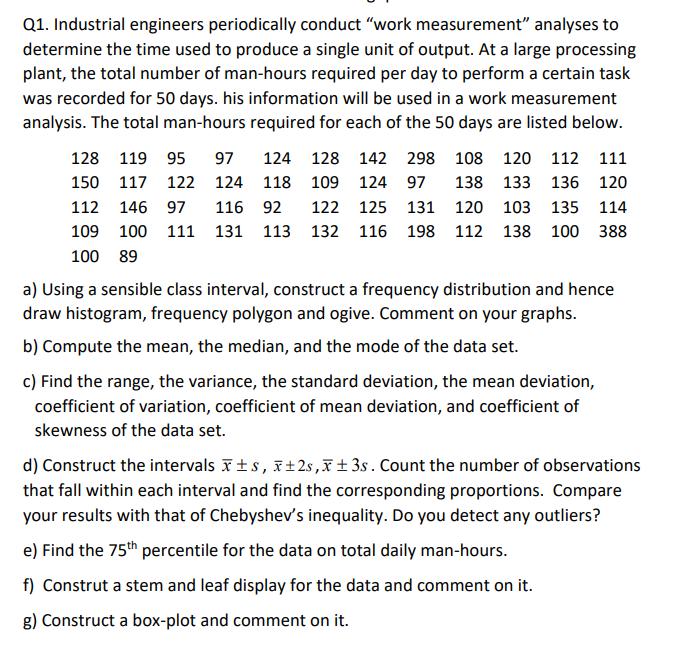
Q1. Industrial engineers periodically conduct work measurement analyses to determine the time used to produce a...
Fantastic news! We've Found the answer you've been seeking!
Question:
Transcribed Image Text:
Q1. Industrial engineers periodically conduct "work measurement" analyses to determine the time used to produce a single unit of output. At a large processing plant, the total number of man-hours required per day to perform a certain task was recorded for 50 days. his information will be used in a work measurement analysis. The total man-hours required for each of the 50 days are listed below. 128 119 95 97 124 128 142 298 108 120 112 111 150 117 122 124 118 109 124 97 138 133 136 120 112 146 97 116 92 122 125 131 120 103 135 114 109 100 111 131 113 132 116 198 112 138 100 388 100 89 a) Using a sensible class interval, construct a frequency distribution and hence draw histogram, frequency polygon and ogive. Comment on your graphs. b) Compute the mean, the median, and the mode of the data set. c) Find the range, the variance, the standard deviation, the mean deviation, coefficient of variation, coefficient of mean deviation, and coefficient of skewness of the data set. d) Construct the intervals ts, I+2s,x+3s. Count the number of observations that fall within each interval and find the corresponding proportions. Compare your results with that of Chebyshev's inequality. Do you detect any outliers? e) Find the 75th percentile for the data on total daily man-hours. f) Construt a stem and leaf display for the data and comment on it. g) Construct a box-plot and comment on it. Q1. Industrial engineers periodically conduct "work measurement" analyses to determine the time used to produce a single unit of output. At a large processing plant, the total number of man-hours required per day to perform a certain task was recorded for 50 days. his information will be used in a work measurement analysis. The total man-hours required for each of the 50 days are listed below. 128 119 95 97 124 128 142 298 108 120 112 111 150 117 122 124 118 109 124 97 138 133 136 120 112 146 97 116 92 122 125 131 120 103 135 114 109 100 111 131 113 132 116 198 112 138 100 388 100 89 a) Using a sensible class interval, construct a frequency distribution and hence draw histogram, frequency polygon and ogive. Comment on your graphs. b) Compute the mean, the median, and the mode of the data set. c) Find the range, the variance, the standard deviation, the mean deviation, coefficient of variation, coefficient of mean deviation, and coefficient of skewness of the data set. d) Construct the intervals ts, I+2s,x+3s. Count the number of observations that fall within each interval and find the corresponding proportions. Compare your results with that of Chebyshev's inequality. Do you detect any outliers? e) Find the 75th percentile for the data on total daily man-hours. f) Construt a stem and leaf display for the data and comment on it. g) Construct a box-plot and comment on it.
Expert Answer:
Answer rating: 100% (QA)
First to do any kind of calculations we have to enter the given data into a Worksheet In case of the given problem we insert the given data into the first column as follows the whole data cannot be sh... View the full answer
Related Book For
Statistics For Engineering And The Sciences
ISBN: 9781498728850
6th Edition
Authors: William M. Mendenhall, Terry L. Sincich
Posted Date:
Students also viewed these mathematics questions
-
Use Excel to calculate the various payroll withholdings, net pay and create the related journal entries. This should look professional in appearance, and be setup as a template (to be used for each...
-
. For the data man-hour data set given in Q1, a) Construct a 94% confidence interval for the mean man-hour (assume normality of the above man-hour data). b) At 1% level of significance test the...
-
A) Consider a sample X, X,X, of normally distributed random variables with variance o= 41. Suppose that n = 41. What is the value of c for which P(S 2c) =0.50? (ii) What is the value of c for which...
-
The people on Coral Island buy only juice and cloth. The CPI market basket contains the quantities bought in 2016. The average household spent $60 on juice and $30 on cloth in 2016 when the price of...
-
Find examples of scarcity in todays headlines.
-
The new cost analyst in your accounting department just received a computer-generated report that contains the results of a simple regression analysis. He was estimating the costs of the marketing...
-
Use the financial data for Randa Merchandising, Inc., in Exercise 13-13 to prepare its income statement for calendar-year 2017. (Ignore the earnings per share section.) Data From Exercise 13.13 In...
-
Haver Company currently produces component RX5 for its sole product. The equipment that is used to produce RX5 must be replaced, and management must decide whether to replace the equipment or buy RX5...
-
If f(x) = x + 3 and g(x) = x + 8x + 15. Determine an equation for y = f(x) * g(x)
-
The phone at Mermans Costume Rentals rings, and Annie Oaklea, head of costume inventory, picks it up and answers a query by saying, Let me take a look at my inventory cards. Sorry, it looks as if...
-
Find the number of subsets of the set {10, 9, 8, 7, 6, 5} having 3 elements. (Hint: Combination)
-
A South African bank experiences a financial deficit and enters into a classic fixed 91 day repurchase agreement with the SARB at a repo rate of 3.50%FOUR of the following bonds serve as the...
-
Sonia is a non-commissioned employee working for LSW, an engineering company in Quebec. Under the terms of her contract, she is required to use her own automobile to travel to various clients across...
-
A firm has commenced production of a new product with a planned selling price of 252,000 KHR. Production was at the planned level of 100,000 units although 20,000 of these remained unsold at the...
-
A string is wrapped several times around the rim of a small hoop with a radius of 0.0800 m and a mass of 0.150 kg. The free end of the string is held in place and the hoop is released from rest...
-
A survey of 100 businesses revealed that the mean after-tax profit was $80,000 and the standard deviation was $15,000. Determine the 90% confidence interval estimate of the mean after-tax profit. a....
-
first answer is wrong and second one is not fully complete soit had to be completed thank you Ben Bradley started Bradley Company on January 1, Year 1. The company experienced the following events...
-
The age-old saying for investing is "buy low and sell high," but this is easier said than done. Investors who panic about falling prices sell their investments, which in turn lowers the price and...
-
The United States Nuclear Regulatory Commission assesses the safety risks associated with nuclear power plants. The commission estimates that the probability of a nuclear reactor core meltdown is 1...
-
Construct an R-chart for the data of Exercise 16.12 to monitor the variation in the diameters of the molded-rubber expansion joints produced by the manufacturing process. Does the process appear to...
-
A new method of planning an ecological network was presented in Landscape Ecology Engineering (Jan. 2013). The methodology protects linear green areas that act as ecological corridors for potential...
-
Do you believe that fraud in the United States is more or less prevalent than fraud in countries outside the United States? Why?
-
How would a fraudster conceal missing cash, especially amounts of this magnitude?
-
Why is it difficult to convict organized crime leaders?
Study smarter with the SolutionInn App