

Use graphs below to answer questions on survival. What is the median survival time, based on Graph
Fantastic news! We've Found the answer you've been seeking!
Question:
- Use graphs below to answer questions on survival.
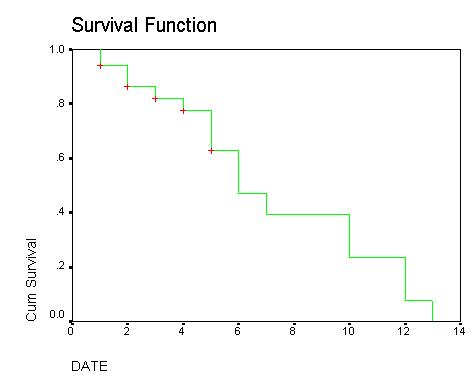
- What is the median survival time, based on Graph 1?
Graph 1. Survival following surgery (X axis: time in days).
- What can you say about the median survival time for Group A (below)?
Graph 2. Survival function for group A.
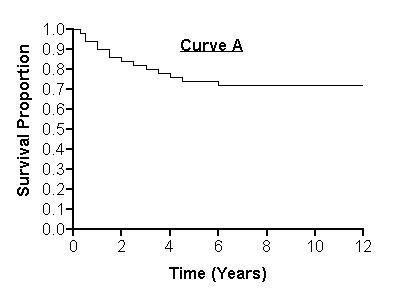
- What is the probability of surviving the entire follow up period?
Graph 1 _____
Graph 2 _______
- You have calculated the survival function and plotted the K-M curve for a group of terminally ill patients following surgery. Based on the graph, what is the probability of surviving a) 1 month after surgery, b) 6 months after surgery, and c) 12 months after surgery?
- What effect can adverse events have on main results of a clinical trial?
- You compare serious adverse event rates in the intervention and control groups, and, while intervention group experiences a higher rate of adverse events, the result is not statistically significant (p>0.05). Does this mean the intervention is safe? What is an appropriate approach in analyzing adverse events?
- Why is ‘intent-to-treat’ the primary analysis of main results in RCTs? (Hint: If compliance with intervention is low, is this analysis likely to overestimate or underestimate treatment effect?
- Adherence to medication taking in your randomized trial was measured using pill count (see table below). Intent- to- treat analysis of the effect of intervention shows that treatment A is more effective than treatment B. What can you say about compliance in the trial, and the effect it could have on the results of your primary analysis? (1 paragraph)
Treatment A (n=100) | Treatment B (n=100) | |
> 90% | 70 | 50 |
50%-89% | 15 | 25 |
20%-49% | 10 | 20 |
5 | 5 |
- Intent- to- treat analysis shows no significant difference in outcome between intervention and control groups in a randomized clinical trial, using a simple 2x2 table. You have recorded the occurrence and time of events (outcome) and loss to follow up. You notice that 40% in each group were lost to follow up over the 3 years of trial duration. A) Discuss the potential impact of loss to follow-up on the results of your trial. B) What other analysis can you perform?
- Results indicate lower mortality in intervention group compared to the control group in a randomized clinical trial. You notice that 40% in intervention group and 10% in the control group were lost to follow up. Discuss potential impact of loss to follow up in this trial.
- You plan multiple interim analyses in a 5-yr trial. What procedure(s) will you use and why?
Expert Answer:
Solution of Graph 1 the median survival time following surgery is 14 days The survival function graph shows the probability of a patient surviving for ... View the full answer

Related Book For 

Database management systems
ISBN: 978-0072465631
3rd edition
Authors: Raghu Ramakrishan, Johannes Gehrke, Scott Selikoff
Posted Date:
