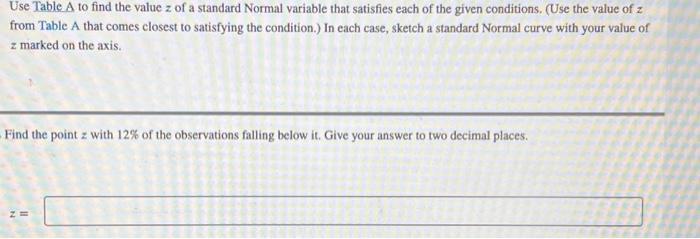
Use Table A to find the value z of a standard Normal variable that satisfies each...
Fantastic news! We've Found the answer you've been seeking!
Question:
Transcribed Image Text:
Use Table A to find the value z of a standard Normal variable that satisfies each of the given conditions. (Use the value of z from Table A that comes closest to satisfying the condition.) In each case, sketch a standard Normal curve with your value of z marked on the axis. Find the point z with 12% of the observations falling below it. Give your answer to two decimal places. Z= TABLE A Standard Normal cumulative proportions .04 .0003 .0004 .0006 .0008 .0012 -3.4 -3.3 -3.2 -3.1 -3.0 -2.9 -2.8 -2.7 -2.6 -2.5 -2.4 -2.3 -2.2 -2.1 -2.0 -1.9 -1.8 -1.7 -1.6 -1.5 -1.4 -13 -1.2 -1.1 -1.0 -0.9 -0.8 -0.7 -0.6 -0.5 -0.4 -0.3 -0.2 -0.1 -0.0 .00 .0003 .0005 .0007 .0010 0013 .0019 .0026 0035 0082 0107 0139 0179 0228 0047 .0045 .0044 0062 0060 .0059 0287 .0359 .0446 0548 .0668 0808 .0968 1151 1357 1587 1841 2119 2420 2743 3085 .01 .02 .0003 .0003 .0005 .0005 .0007 0006 .0009 .0009 0013 .0013 .3446 3821 4207 4602 5000 .0018 0025 0034 .0080 0104 0136 0174 0222 0281 0351 0436 0537 0655 .0793 0951 1131 1335 1562 1814 2090 2389 2709 3050 3409 3783 4168 .0018 0024 0033 4562 4960 .0078 0102 0132 0170 0217 .0274 0344 0427 0526 .0643 0778 0934 1112 .1314 1539 1788 2061 2358 2676 3015 3372 3745 4129 4522 4920 .03 .0003 0004 .0006 .0009 0012 .0017 .0023 .0032 .0043 .0057 .0075 .0073 .0099 .0096 0125 0162 .0207 0129 .0166 0212 .0268 0336 0418 .0516 .0630 .0764 0918 .1093 .1292 1515 1762 2033 2327 2643 .2981 3336 3707 4090 4483 4880 .0016 .0016 .0023 .0022 .0031 .0030 .0041 .0055 .0262 0329 0409 0505 0618 1736 2005 .2296 2611 2946 .05 .0003 .0004 .0006 3300 3669 4052 .0008 .0011 4443 4840 .0040 .0054 .0749 .0735 .0901 0885 1075 1056 1271 1492 .0071 .0094 0122 .0158 .0202 0256 0322 0401 .0495 .0606 1251 .1469 1711 1977 2266 2578 2912 3264 3632 4013 4404 4801 .06 .0003 .0004 .0006 .0008 .0011 .0015 .0021 .0029 .0039 .0052 .0069 .0091 0119 .0154 .0197 0250 0314 .0392 0485 .0594 .0721 0869 1038 1230 .1446 1685 .1949 .2236 2546 2877 3228 3594 3974 4364 4761 .07 0003 .0004 .0005 .0008 .0011 .0015 0021 .0028 0038 0051 .0068 .0089 .0116 .0150 .0192 0244 .0307 0384 .0475 0582 .0708 0853 .1020 1210 1423 .1660 1922 .2206 2514 2843 .3192 3557 3936 4325 4721 .08 .0003 0004 .0005 0007 .0010 .0014 0020 0027 0037 .0049 .0066 0087 0113 .0146 0188 0239 .0301 0375 0465 0571 .0694 .0838 1003 1190 1401 1635 1894 2177 2483 .2810 3156 3520 3897 4286 4681 .09 0002 .0003 ,0005 .0007 0010 0014 .0019 .0026 .0036 .0048 .0064 0084 0110 0143 0183 0233 0294 .0367 0455 0559 0681 .0823 0985 1170 1379 1611 1867 2148 2451 2776 .3121 3483 3859 4247 4641 Use Table A to find the value z of a standard Normal variable that satisfies each of the given conditions. (Use the value of z from Table A that comes closest to satisfying the condition.) In each case, sketch a standard Normal curve with your value of z marked on the axis. Find the point z with 12% of the observations falling below it. Give your answer to two decimal places. Z= TABLE A Standard Normal cumulative proportions .04 .0003 .0004 .0006 .0008 .0012 -3.4 -3.3 -3.2 -3.1 -3.0 -2.9 -2.8 -2.7 -2.6 -2.5 -2.4 -2.3 -2.2 -2.1 -2.0 -1.9 -1.8 -1.7 -1.6 -1.5 -1.4 -13 -1.2 -1.1 -1.0 -0.9 -0.8 -0.7 -0.6 -0.5 -0.4 -0.3 -0.2 -0.1 -0.0 .00 .0003 .0005 .0007 .0010 0013 .0019 .0026 0035 0082 0107 0139 0179 0228 0047 .0045 .0044 0062 0060 .0059 0287 .0359 .0446 0548 .0668 0808 .0968 1151 1357 1587 1841 2119 2420 2743 3085 .01 .02 .0003 .0003 .0005 .0005 .0007 0006 .0009 .0009 0013 .0013 .3446 3821 4207 4602 5000 .0018 0025 0034 .0080 0104 0136 0174 0222 0281 0351 0436 0537 0655 .0793 0951 1131 1335 1562 1814 2090 2389 2709 3050 3409 3783 4168 .0018 0024 0033 4562 4960 .0078 0102 0132 0170 0217 .0274 0344 0427 0526 .0643 0778 0934 1112 .1314 1539 1788 2061 2358 2676 3015 3372 3745 4129 4522 4920 .03 .0003 0004 .0006 .0009 0012 .0017 .0023 .0032 .0043 .0057 .0075 .0073 .0099 .0096 0125 0162 .0207 0129 .0166 0212 .0268 0336 0418 .0516 .0630 .0764 0918 .1093 .1292 1515 1762 2033 2327 2643 .2981 3336 3707 4090 4483 4880 .0016 .0016 .0023 .0022 .0031 .0030 .0041 .0055 .0262 0329 0409 0505 0618 1736 2005 .2296 2611 2946 .05 .0003 .0004 .0006 3300 3669 4052 .0008 .0011 4443 4840 .0040 .0054 .0749 .0735 .0901 0885 1075 1056 1271 1492 .0071 .0094 0122 .0158 .0202 0256 0322 0401 .0495 .0606 1251 .1469 1711 1977 2266 2578 2912 3264 3632 4013 4404 4801 .06 .0003 .0004 .0006 .0008 .0011 .0015 .0021 .0029 .0039 .0052 .0069 .0091 0119 .0154 .0197 0250 0314 .0392 0485 .0594 .0721 0869 1038 1230 .1446 1685 .1949 .2236 2546 2877 3228 3594 3974 4364 4761 .07 0003 .0004 .0005 .0008 .0011 .0015 0021 .0028 0038 0051 .0068 .0089 .0116 .0150 .0192 0244 .0307 0384 .0475 0582 .0708 0853 .1020 1210 1423 .1660 1922 .2206 2514 2843 .3192 3557 3936 4325 4721 .08 .0003 0004 .0005 0007 .0010 .0014 0020 0027 0037 .0049 .0066 0087 0113 .0146 0188 0239 .0301 0375 0465 0571 .0694 .0838 1003 1190 1401 1635 1894 2177 2483 .2810 3156 3520 3897 4286 4681 .09 0002 .0003 ,0005 .0007 0010 0014 .0019 .0026 .0036 .0048 .0064 0084 0110 0143 0183 0233 0294 .0367 0455 0559 0681 .0823 0985 1170 1379 1611 1867 2148 2451 2776 .3121 3483 3859 4247 4641
Expert Answer:
Answer rating: 100% (QA)
The value for z of 12 of the observations falling below it is obtained below From the S... View the full answer
Related Book For
Managerial Decision Modeling Business Analytics With Spreadsheet
ISBN: 9781501515101
4th Edition
Authors: Nagraj Balakrishnan, Barry Render, Ralph Stair, Charles Munson
Posted Date:
Students also viewed these economics questions
-
Use the standard normal table in Appendix A to find the area a. At or below a point 1.64 standard deviations to the right of the mean. b. At or below a point 2.33 standard deviations to the left of...
-
Use Table IX on page 13-74 to find the value of A2 for each of the following sample sizes. a. n = 3 b. n = 10 c. n = 22 Table X Control Chart Constants Number of Observations in Subgroup, n A2 d2 da...
-
If a 2 digit positive integer has its digits reversed, the resulting integer differs from the original by 27. By how much do the two digits differ?
-
Consider the no-trade input/output situation presented in the following table for countries X and Y. Assuming that free trade is allowed, develop a scenario that will benefit the citizens of...
-
Water enters a pump steadily at 100 kPa at a rate of 35 L/s and leaves at 800 kPa. The flow velocities at the inlet and the exit are the same, but the pump exit where the discharge pressure is...
-
WHETHER TO DISCONTINUE A DEPARTMENT Mueller and Kenington Company is trying to decide whether to discontinue department A. Operating results for the year just ended for each of the company's three...
-
Barrett, Inc., restores antique automobiles. The retained earnings balance of the corporation was \($28,500\) at December 31,2009. During 2010, the corporation paid \($35,000\) in dividends to its...
-
Using the following table as a guide, describe for each function (Figure): a. A risk (an event or action that will cause the organization to fail to meet its goals/ objectives) b. A control/ process...
-
Assume that Bob and Doug each have a Capital Account of $ 1 5 million Mr . Lee wants to join the partnership. Bob and Doug s law firm partnership is super profitable, and for Mr . Lee to join their...
-
2. A double-spool turbofan engine is used to power an aircraft flying at speed of 250 m/s at an altitude of 11,000 m, where ambient temperature is -50C and pressure is 22.7 kPa. As shown below, the...
-
Explain Stanley Milgram's leadership study. What is the central problem Milgram is trying to understand, and why? Aware of Milgram's findings (explain what they are) what could modern leaders do...
-
Look at the ASCII chart in Appendix A and determine the codes for each letter of your first name.
-
A spring has a cubic nonlinearity which is an example of a (geometric, material) _______________________________ nonlinearity.
-
Use the Three-Question Method to verify the ValueInList function described in this chapter.
-
What is a small population? What is a finite multiplier in the context of a small population?
-
In the latter half of the 20th and early 21st centuries, with the birth of the internet and as participation and consumption of social media grew, bigger was deemed as being better. Assertive and...
-
How much should be invested each year for 10 years to provide you with $8000 per year for the next 35 years? Assume a 5.5% interest rate. (Round your final answer to two decimal places.)
-
Provide a few individual examples who revealed what aspects of emotional intelligence?
-
If you look carefully at the formulas in this chapter for all four unlimited population models, you can verify that for each one, L = W and Lq = Wq. These are instances of the more general...
-
Consider the linear programming formulation below. Which constraint is redundant? Maximize profit = 4X + 4Y subject to the constraints 6X + 4Y 120 3X + 8Y 120 2X + 2.5Y 100 X, Y 0
-
Solve the following LP problem by using the graphical procedure and by using Excel: Minimize cost = 4X + 7Y subject to the constraints 3X + 6Y 100 10X + 2Y 160 2Y 40 2X 75 X, Y 0
-
Which of the following is not a condition that potentially increases the entity's business risk? a. The entity's information system is not adequate to handle its volume of sales transactions. b. The...
-
Define auditing, attest, and assurance services. Provide two examples of each type of service.
-
Which of the following, if material, would be fraud? a. Mistakes in the application of accounting principles. b. Clerical mistakes in the accounting data underlying the financial statements. c....
Study smarter with the SolutionInn App