

Use the data contained in the case to estimate the postmerger cash flows for 2018 through...
Fantastic news! We've Found the answer you've been seeking!
Question:

Transcribed Image Text:
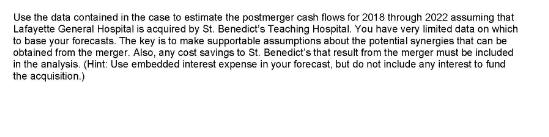
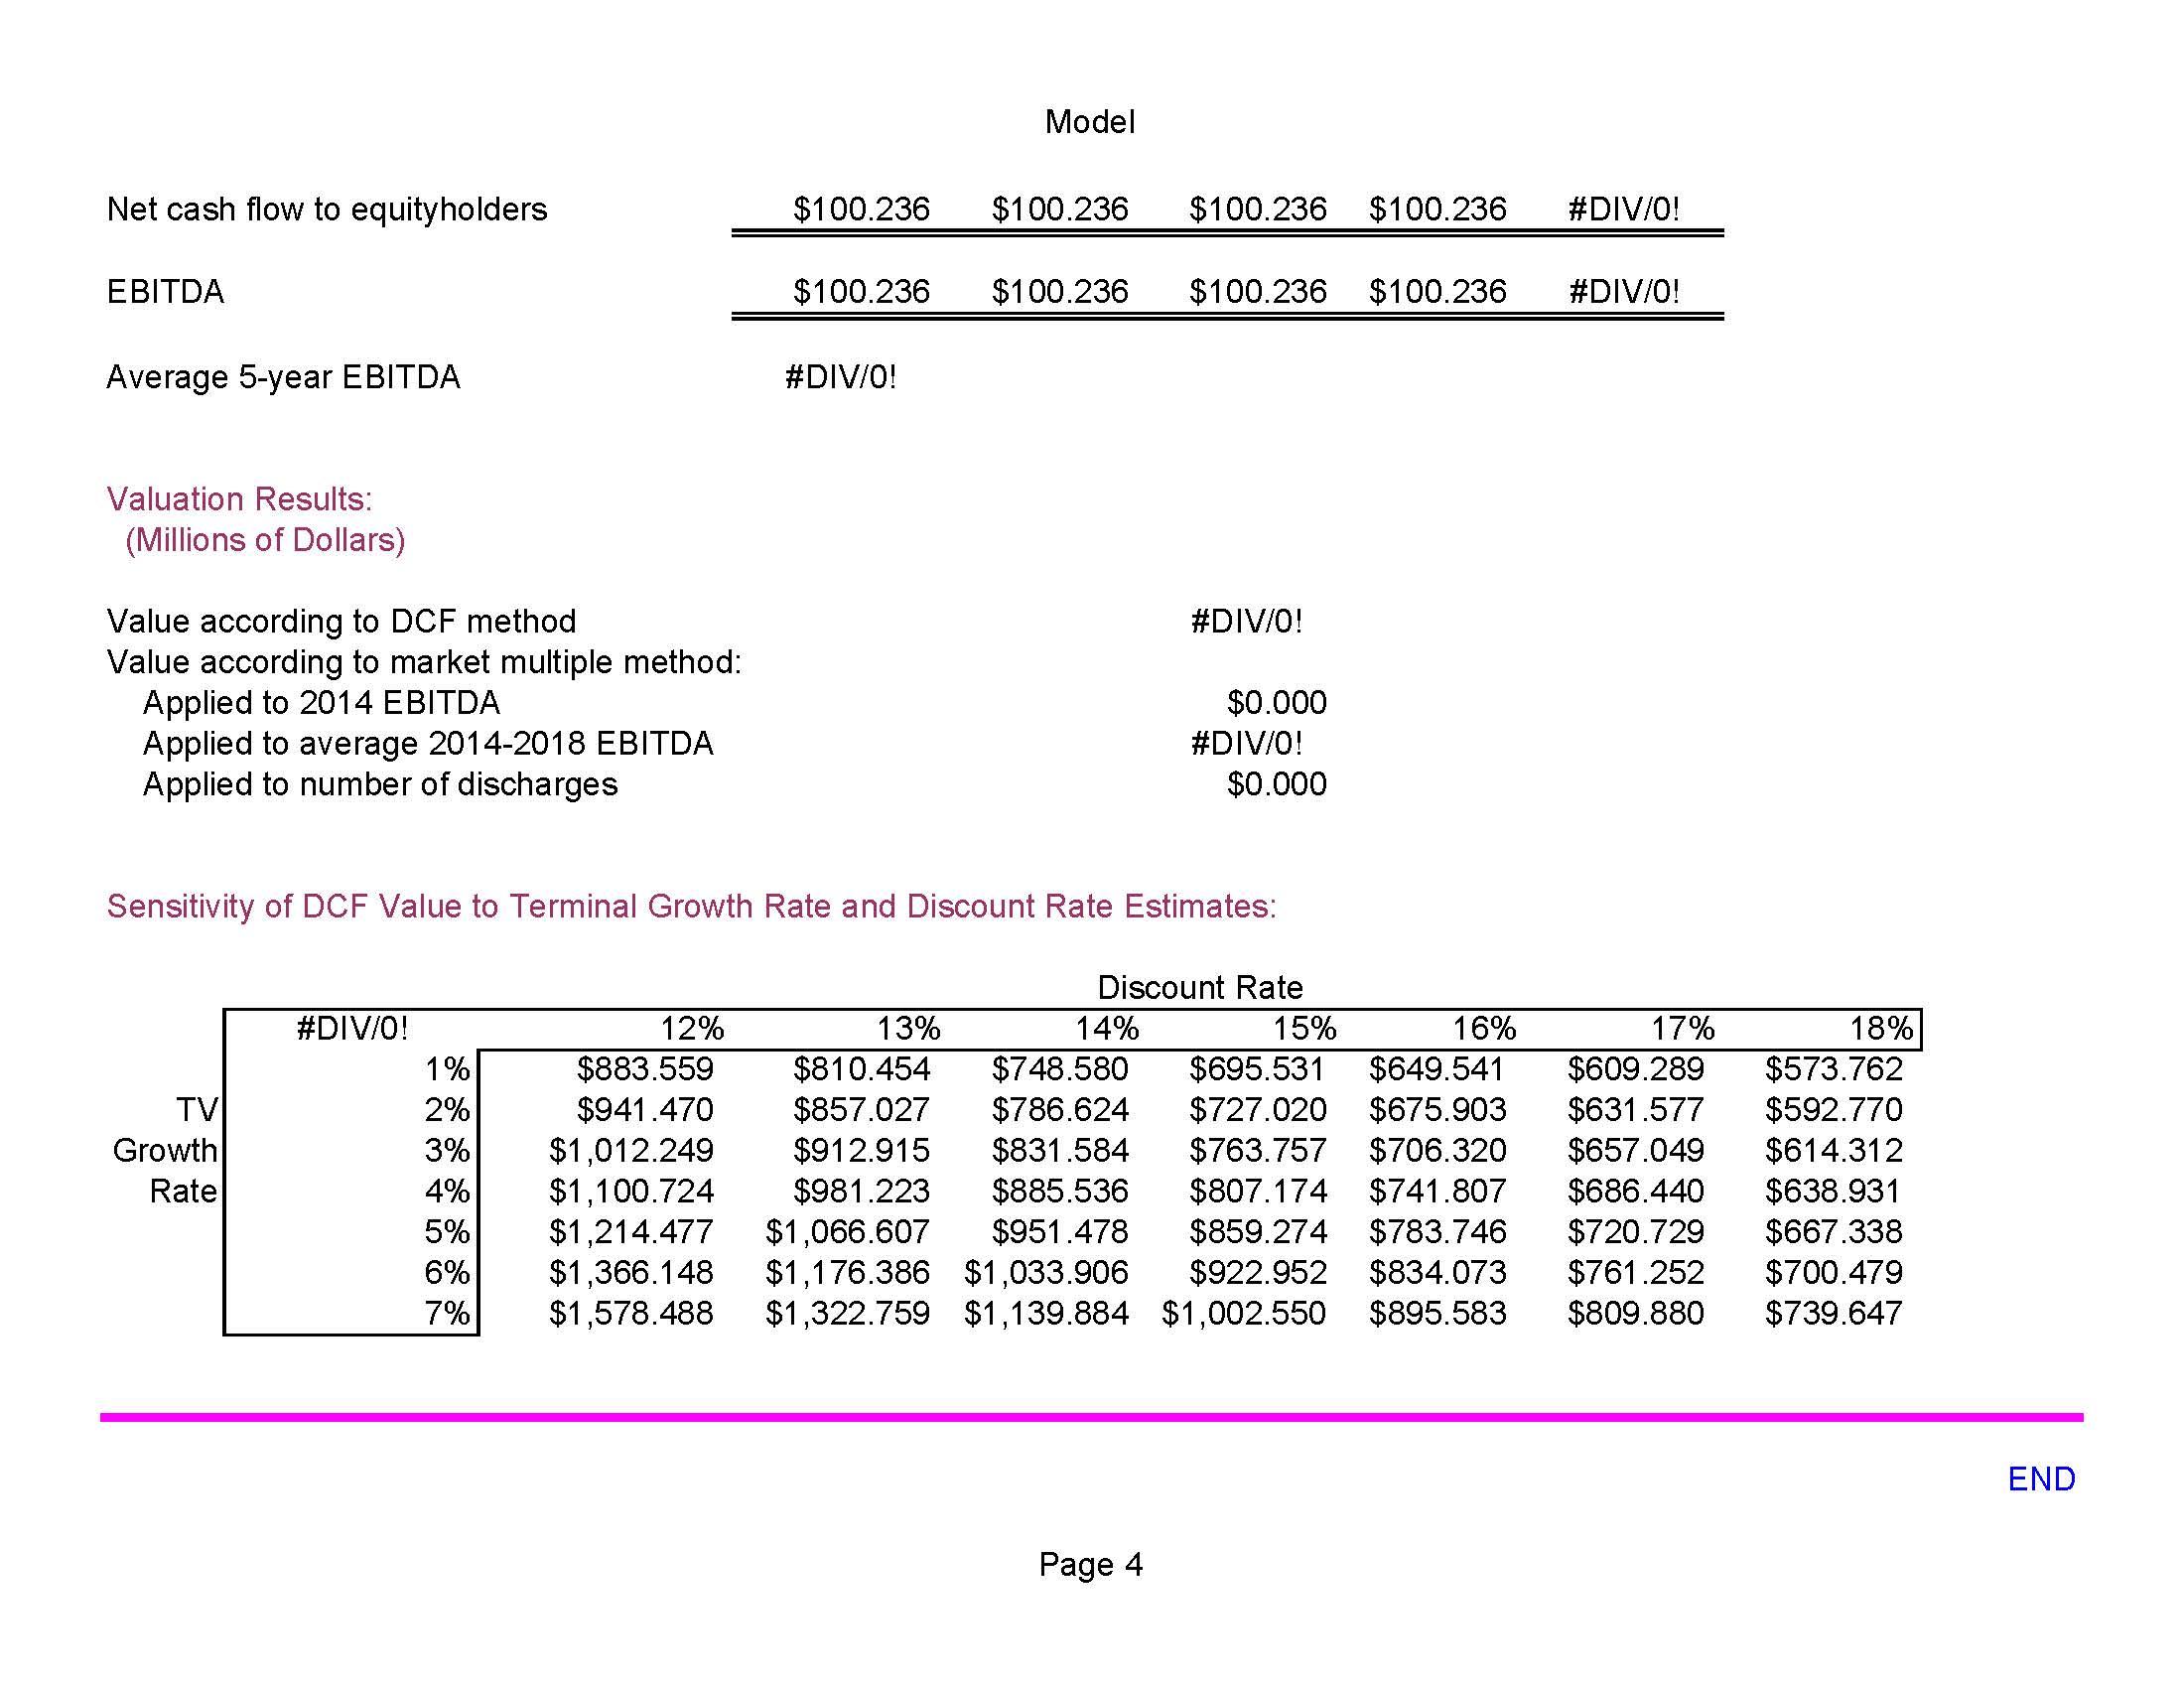
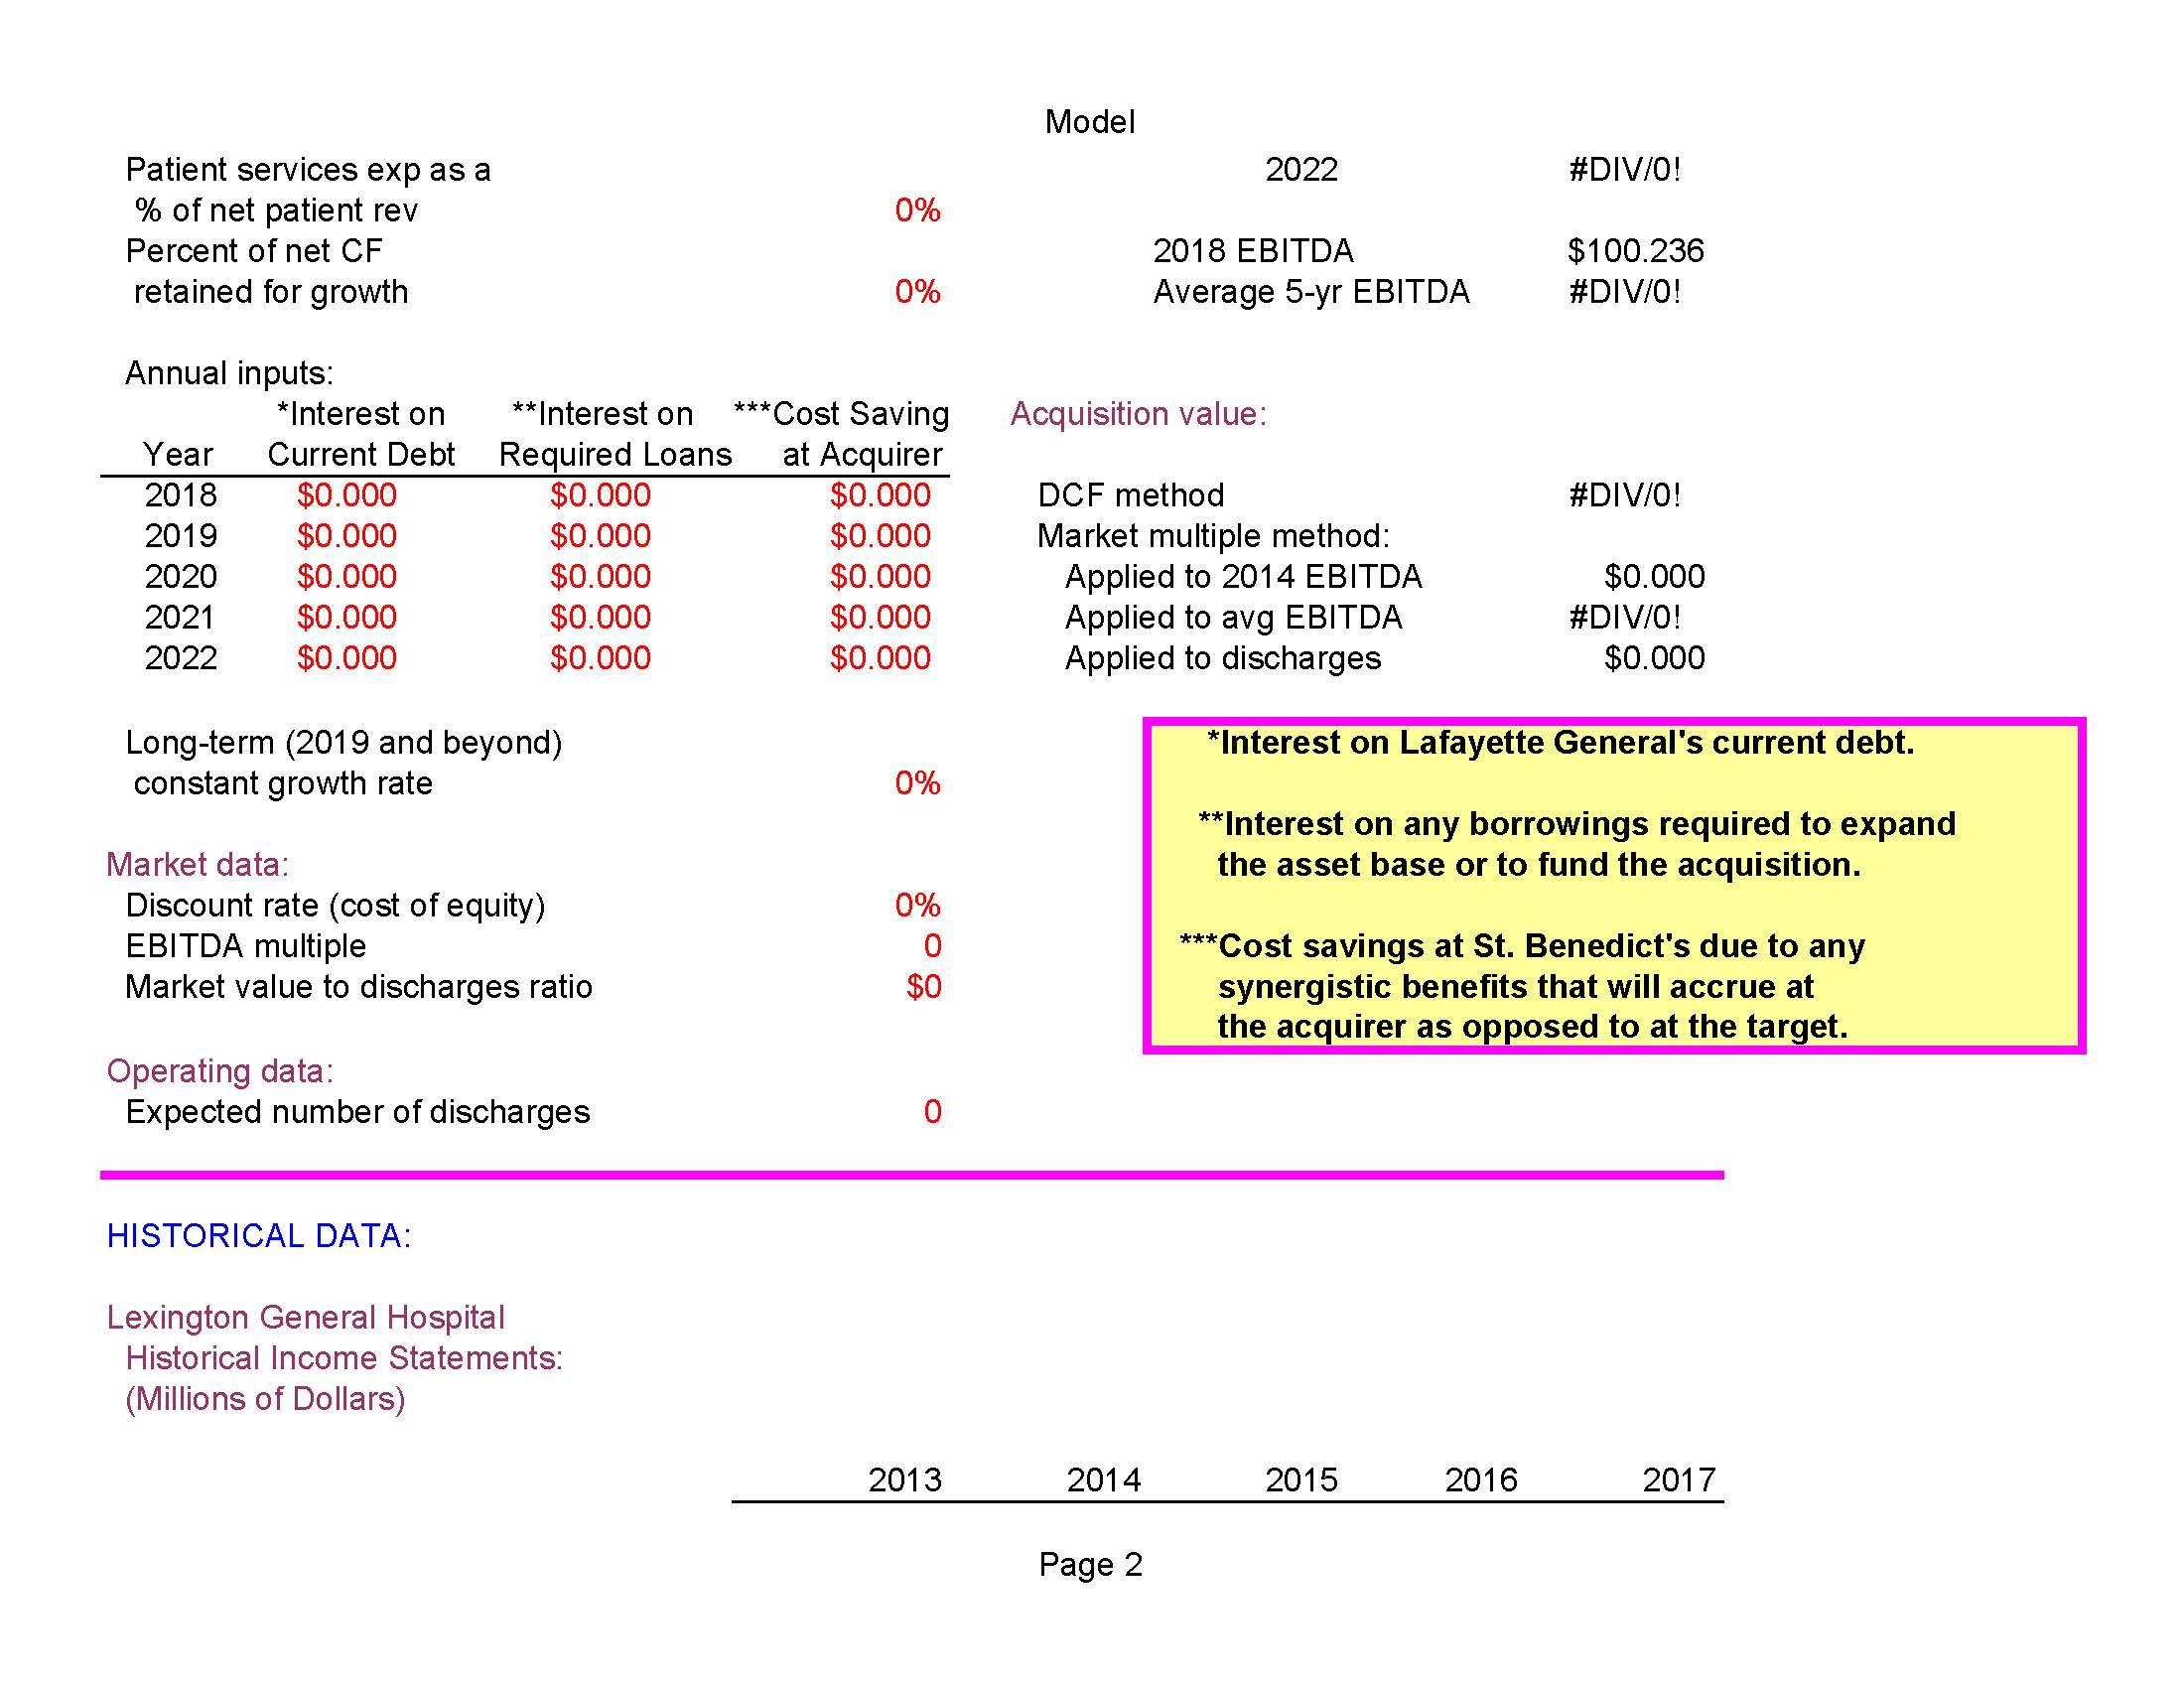
Use the data contained in the case to estimate the postmerger cash flows for 2018 through 2022 assuming that Lafayette General Hospital is acquired by St. Benedict's Teaching Hospital. You have very limited data on which to base your forecasts. The key is to make supportable assumptions about the potential synergies that can be obtained from the merger. Also, any cost savings to St. Benedict's that result from the merger must be included in the analysis. (Hint: Use embedded interest expense in your forecast, but do not include any interest to fund the acquisition.) Net cash flow to equityholders EBITDA Average 5-year EBITDA Valuation Results: (Millions of Dollars) Value according to DCF method Value according to market multiple method: Applied to 2014 EBITDA Applied to average 2014-2018 EBITDA Applied to number of discharges TV Growth Rate #DIV/0! 1% 2% 3% 4% 5% 6% 7% Model $100.236 $100.236 $100.236 $100.236 #DIV/0! $100.236 $100.236 $100.236 $100.236 #DIV/0! #DIV/0! Sensitivity of DCF Value to Terminal Growth Rate and Discount Rate Estimates: #DIV/0! $0.000 #DIV/0! $0.000 Page 4 17% 18% $573.762 12% $883.559 $941.470 $1,012.249 Discount Rate 13% 14% 15% 16% $810.454 $748.580 $695.531 $649.541 $609.289 $857.027 $786.624 $727.020 $675.903 $631.577 $912.915 $831.584 $763.757 $706.320 $657.049 $614.312 $885.536 $686.440 $638.931 $1,214.477 $1,066.607 $951.478 $859.274 $783.746 $720.729 $667.338 $1,366.148 $1,176.386 $1,033.906 $922.952 $834.073 $761.252 $700.479 $1,578.488 $1,322.759 $1,139.884 $1,002.550 $895.583 $809.880 $739.647 $592.770 $1,100.724 $981.223 $807.174 $741.807 END Inpatient revenue Outpatient revenue Net patient service revenue Nonoperating revenue Total revenues Patient services expenses Interest expense Depreciation Total expenses Net income MODEL-GENERATED DATA: Inpatient revenue Outpatient revenue Net patient service revenue Nonoperating revenue $42.472 28.314 $70.786 1.922 $72.708 $60.245 3.045 3.466 $66.756 Lexington General Hospital Pro Forma (Forecasted) Cash Flow Statements: (Millions of Dollars) Total revenues Patient services expenses Interest expense Total expenses Net operating cash flow Cost savings at teaching (other) hospital Growth retentions Terminal value $5.952 2018 $59.513 39.675 $99.188 1.048 $100.236 $0.00 0.000 $0.000 $100.236 0.000 0.000 Model $46.014 30.676 $76.690 1.515 $78.205 $73.858 3.147 3.689 $80.694 ($2.489) 2019 $59.513 39.675 $99.188 1.048 $100.236 $0.00 0.000 $0.000 $100.236 0.000 0.000 Page 3 $53.410 $58.650 35.606 39.100 $89.016 $97.750 1.367 1.725 $90.383 $99.475 $81.525 $90.645 3.093 4.395 $89.013 $1.370 2020 3.002 4.258 $97.905 2021 $59.513 $59.513 39.675 39.675 $99.188 $99.188 1.048 1.048 $100.236 $100.236 $0.00 $0.00 0.000 0.000 $0.000 $0.000 $100.236 $100.236 0.000 0.000 $1.570 0.000 0.000 $59.513 39.675 $99.188 1.048 $100.236 $89.505 2.980 6.031 $98.516 $1.720 2022 $59.513 39.675 $99.188 1.048 $100.236 $0.00 0.000 $0.000 $100.236 0.000 0.000 #DIV/0! Patient services exp as a % of net patient rev Percent of net CF retained for growth Annual inputs: *Interest on Year Current Debt 2018 2019 2020 2021 2022 $0.000 $0.000 $0.000 $0.000 $0.000 **Interest on Required Loans $0.000 $0.000 $0.000 $0.000 $0.000 Long-term (2019 and beyond) constant growth rate Market data: Discount rate (cost of equity) EBITDA multiple Market value to discharges ratio HISTORICAL DATA: Operating data: Expected number of discharges Lexington General Hospital Historical Income Statements: (Millions of Dollars) 0% *** 0% *Cost Saving at Acquirer $0.000 $0.000 $0.000 $0.000 $0.000 0% 0% 0 $0 0 2013 Model Acquisition value: 2014 2022 2018 EBITDA Average 5-yr EBITDA DCF method Market multiple method: Applied to 2014 EBITDA Applied to avg EBITDA Applied to discharges Page 2 *** #DIV/0! 2015 $100.236 #DIV/0! 2016 #DIV/0! $0.000 *Interest on Lafayette General's current debt. **Interest on any borrowings required to expand the asset base or to fund the acquisition. #DIV/0! $0.000 *Cost savings at St. Benedict's due to any synergistic benefits that will accrue at the acquirer as opposed to at the target. 2017 Model CASE 30 ST. JOSEPH'S TEACHING HOSPITAL: Merger Analysis Model with Questions, Student Version This case consists of a valuation analysis on a 400-bed acute care hospital. The model uses both discounted cash flow (DCF) and market multiple methodologies for the valuation. The DCF method focuses on cash flows to equityholders. The INPUT DATA section of the model contains key assumptions needed to generate the pro forma (forecasted) cash flow statements. In addition, historical data used in the forecasting process is contained in its own section. The model consists of a complete base case analysis--no changes need to be made to the existing MODEL-GENERATED DATA section. However, values in the INPUT DATA section of the student spreadsheet have been replaced by zeros. Students must select appropriate input values and enter them into the cells with values colored red. After this is done, any error cells will be corrected and the base case solution will appear. The KEY OUTPUT section includes the most important output from the MODEL-GENERATED DATA section. INPUT DATA: (millions of $) Cash flow data: Growth in revenues (2018-2022): Inpatient Outpatient Nonoperating 0% 0% 0% KEY OUTPUT: (millions of $) Pro forma (forecasted) net cash flows: 2018 2019 2020 2021 Page 1 $100.236 $100.236 $100.236 $100.236 Use the data contained in the case to estimate the postmerger cash flows for 2018 through 2022 assuming that Lafayette General Hospital is acquired by St. Benedict's Teaching Hospital. You have very limited data on which to base your forecasts. The key is to make supportable assumptions about the potential synergies that can be obtained from the merger. Also, any cost savings to St. Benedict's that result from the merger must be included in the analysis. (Hint: Use embedded interest expense in your forecast, but do not include any interest to fund the acquisition.) Net cash flow to equityholders EBITDA Average 5-year EBITDA Valuation Results: (Millions of Dollars) Value according to DCF method Value according to market multiple method: Applied to 2014 EBITDA Applied to average 2014-2018 EBITDA Applied to number of discharges TV Growth Rate #DIV/0! 1% 2% 3% 4% 5% 6% 7% Model $100.236 $100.236 $100.236 $100.236 #DIV/0! $100.236 $100.236 $100.236 $100.236 #DIV/0! #DIV/0! Sensitivity of DCF Value to Terminal Growth Rate and Discount Rate Estimates: #DIV/0! $0.000 #DIV/0! $0.000 Page 4 17% 18% $573.762 12% $883.559 $941.470 $1,012.249 Discount Rate 13% 14% 15% 16% $810.454 $748.580 $695.531 $649.541 $609.289 $857.027 $786.624 $727.020 $675.903 $631.577 $912.915 $831.584 $763.757 $706.320 $657.049 $614.312 $885.536 $686.440 $638.931 $1,214.477 $1,066.607 $951.478 $859.274 $783.746 $720.729 $667.338 $1,366.148 $1,176.386 $1,033.906 $922.952 $834.073 $761.252 $700.479 $1,578.488 $1,322.759 $1,139.884 $1,002.550 $895.583 $809.880 $739.647 $592.770 $1,100.724 $981.223 $807.174 $741.807 END Inpatient revenue Outpatient revenue Net patient service revenue Nonoperating revenue Total revenues Patient services expenses Interest expense Depreciation Total expenses Net income MODEL-GENERATED DATA: Inpatient revenue Outpatient revenue Net patient service revenue Nonoperating revenue $42.472 28.314 $70.786 1.922 $72.708 $60.245 3.045 3.466 $66.756 Lexington General Hospital Pro Forma (Forecasted) Cash Flow Statements: (Millions of Dollars) Total revenues Patient services expenses Interest expense Total expenses Net operating cash flow Cost savings at teaching (other) hospital Growth retentions Terminal value $5.952 2018 $59.513 39.675 $99.188 1.048 $100.236 $0.00 0.000 $0.000 $100.236 0.000 0.000 Model $46.014 30.676 $76.690 1.515 $78.205 $73.858 3.147 3.689 $80.694 ($2.489) 2019 $59.513 39.675 $99.188 1.048 $100.236 $0.00 0.000 $0.000 $100.236 0.000 0.000 Page 3 $53.410 $58.650 35.606 39.100 $89.016 $97.750 1.367 1.725 $90.383 $99.475 $81.525 $90.645 3.093 4.395 $89.013 $1.370 2020 3.002 4.258 $97.905 2021 $59.513 $59.513 39.675 39.675 $99.188 $99.188 1.048 1.048 $100.236 $100.236 $0.00 $0.00 0.000 0.000 $0.000 $0.000 $100.236 $100.236 0.000 0.000 $1.570 0.000 0.000 $59.513 39.675 $99.188 1.048 $100.236 $89.505 2.980 6.031 $98.516 $1.720 2022 $59.513 39.675 $99.188 1.048 $100.236 $0.00 0.000 $0.000 $100.236 0.000 0.000 #DIV/0! Patient services exp as a % of net patient rev Percent of net CF retained for growth Annual inputs: *Interest on Year Current Debt 2018 2019 2020 2021 2022 $0.000 $0.000 $0.000 $0.000 $0.000 **Interest on Required Loans $0.000 $0.000 $0.000 $0.000 $0.000 Long-term (2019 and beyond) constant growth rate Market data: Discount rate (cost of equity) EBITDA multiple Market value to discharges ratio HISTORICAL DATA: Operating data: Expected number of discharges Lexington General Hospital Historical Income Statements: (Millions of Dollars) 0% *** 0% *Cost Saving at Acquirer $0.000 $0.000 $0.000 $0.000 $0.000 0% 0% 0 $0 0 2013 Model Acquisition value: 2014 2022 2018 EBITDA Average 5-yr EBITDA DCF method Market multiple method: Applied to 2014 EBITDA Applied to avg EBITDA Applied to discharges Page 2 *** #DIV/0! 2015 $100.236 #DIV/0! 2016 #DIV/0! $0.000 *Interest on Lafayette General's current debt. **Interest on any borrowings required to expand the asset base or to fund the acquisition. #DIV/0! $0.000 *Cost savings at St. Benedict's due to any synergistic benefits that will accrue at the acquirer as opposed to at the target. 2017 Model CASE 30 ST. JOSEPH'S TEACHING HOSPITAL: Merger Analysis Model with Questions, Student Version This case consists of a valuation analysis on a 400-bed acute care hospital. The model uses both discounted cash flow (DCF) and market multiple methodologies for the valuation. The DCF method focuses on cash flows to equityholders. The INPUT DATA section of the model contains key assumptions needed to generate the pro forma (forecasted) cash flow statements. In addition, historical data used in the forecasting process is contained in its own section. The model consists of a complete base case analysis--no changes need to be made to the existing MODEL-GENERATED DATA section. However, values in the INPUT DATA section of the student spreadsheet have been replaced by zeros. Students must select appropriate input values and enter them into the cells with values colored red. After this is done, any error cells will be corrected and the base case solution will appear. The KEY OUTPUT section includes the most important output from the MODEL-GENERATED DATA section. INPUT DATA: (millions of $) Cash flow data: Growth in revenues (2018-2022): Inpatient Outpatient Nonoperating 0% 0% 0% KEY OUTPUT: (millions of $) Pro forma (forecasted) net cash flows: 2018 2019 2020 2021 Page 1 $100.236 $100.236 $100.236 $100.236
Expert Answer:
Answer rating: 100% (QA)
ANSWER To estimate the postmerger cash flows for 2018 through 2022 we need to make several assumptions about the potential synergies that can be obtained from the merger and any cost savings that can ... View the full answer

Related Book For 

Financial Reporting Financial Statement Analysis and Valuation a strategic perspective
ISBN: 978-1337614689
9th edition
Authors: James M. Wahlen, Stephen P. Baginski, Mark Bradshaw
Posted Date:
Students also viewed these accounting questions
-
The patient base of Lexington County, South Carolina, is currently served by three hospitals: (1) St. Josephs Teaching Hospital, a not-for-profit, university- related hospital with 525 beds; (2)...
-
List three specific parts of the Case Guide, Objectives and Strategy Section (See below) that you had the most difficulty understanding. Describe your current understanding of these parts. Provide...
-
Read the case study "Southwest Airlines," found in Part 2 of your textbook. Review the "Guide to Case Analysis" found on pp. CA1 - CA11 of your textbook. (This guide follows the last case in the...
-
What future directions may be interesting for comparative studies in corporate governance?
-
Journal entries, T-accounts and source documents. Production Company produces gadgets for the coveted small appliance market. The following data reflects activity for the year 2008. Production Co....
-
Why does the placement of blame have no place in the postproject evaluation process?
-
Onstar Communication issued \(\$ 100,000\) of \(6 \%, 10\)-year bonds payable on October 1, 2008, at par value. Onstar's accounting year ends on December 31. Journalize the following transactions....
-
Hayes (2000) took a stratified sample of New York City food stores. The sampling frame consisted of 1408 food stores with at least 4000 square feet of retail space. The population of stores was...
-
The easiest way to do this is to copy the original data to a new sheet and then replace the original data parameters. To copy a sheet, click on the sheet name. Select "Move or Copy." Click on the...
-
Mr. M has been employed as an engineer by A Ltd., a company incorporated in Hong Kong. During the year ended 31 March 2019, Mr. M had the following income and expenditure. A monthly salary of...
-
Cott, Inc. prepared an interest amortization table for a fiveyear lease payable with a bargain purchase option of $2,000, exercisable at the end of the lease. At the end of the five years, the...
-
Calculate the integral of g(x,y) = 4x + 3y over the region [0,4] x [0,3]
-
Use the intermediate value theorem to show that f has a zero between a and b.
-
Use synthetic division to find f(c). 37 f(x) 2x3 + 3x - 4x + 4; c=3
-
Circle T is shown below. M T N P Nina measured the length of line segment MP as 20 centimeters (cm). What is the length of line segment NT?
-
A cylindrical metal can with radius r (in cm) and height h (in cm) is to be designed to hold a volume of 100 cubic centimeters. What value of r minimizes the amount of metal (in square centimeters)...
-
Some states permit either a custodial arrest or the release of a suspect by the use of a citation (ROR) which requires an appearance in court at a later date. Should we permit an officer to determine...
-
What is the role of business risk analysis in the audit planning process?
-
Apply the economic attributes framework discussed in the chapter to the specialty retailing apparel industry, which includes such firms as Gap, Limited Brands, and Abercrombie & Fitch.
-
Prime Contractors (Prime) is a privately owned company that contracts with the U.S. government to provide various services under multiyear (usually five-year) contracts. Its principal services are as...
-
Assume Walmart acquires a tract of land on January 1, 2016, for $100,000 cash. On December 31, 2016, the current market value of the land is $150,000. On December 31, 2017, the current market value...
-
A healthy diet is becoming increasingly important for consumers, especially women aged 2535. As a result, they are taking active steps to ensure they are eating healthy but are also looking for other...
-
Lael was just hired by Best East Motels into their manager training program and was excited about the potential benefits after her graduation from Florida State University. Working part-time and...
-
Sophie just completed a sales training course with one of the firms most productive sales representatives, Emma. At the end of the first week, Sophie and Emma sat in a motel room filling out their...

Study smarter with the SolutionInn App