

Use the Excel file (DT4-1.xlsx) to execute the following analyses: 1. Calculate the amount of sales...
Fantastic news! We've Found the answer you've been seeking!
Question:
Transcribed Image Text:
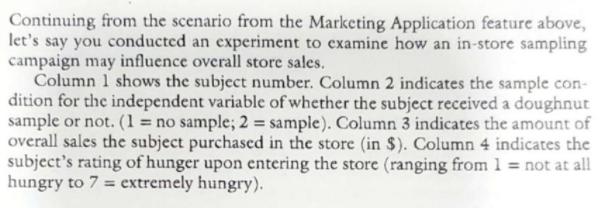
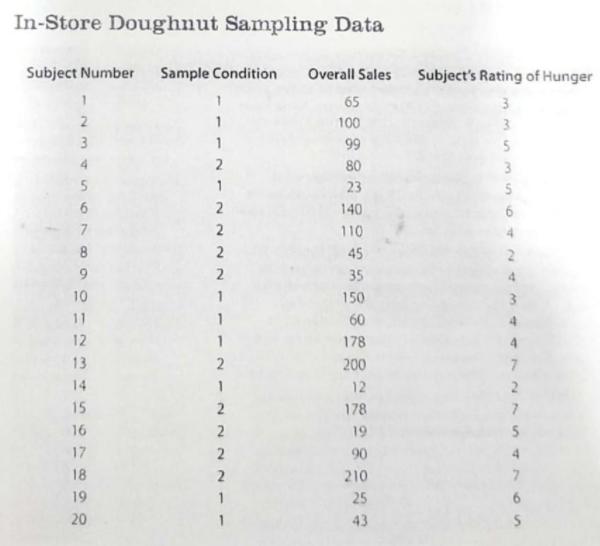
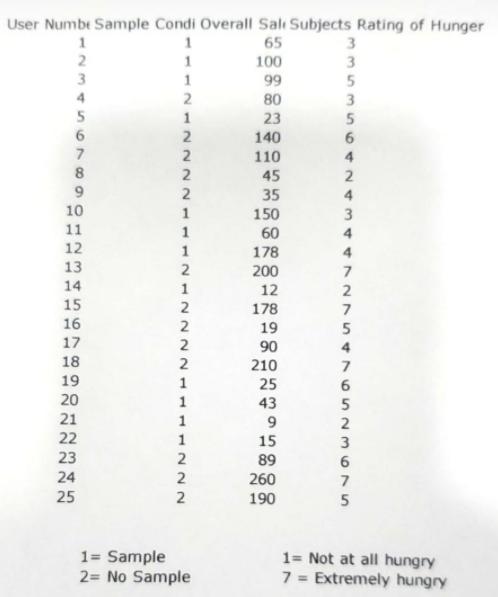
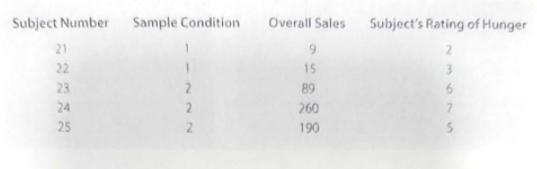
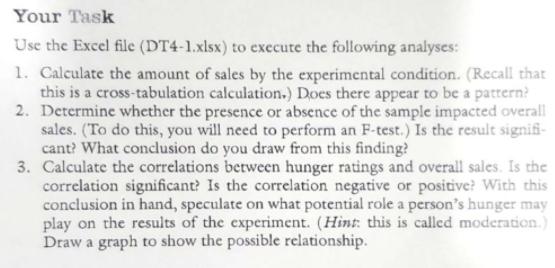
Use the Excel file (DT4-1.xlsx) to execute the following analyses: 1. Calculate the amount of sales by the experimental condition. (Recall that this is a cross-tabulation calculation.) Does there appear to be a pattern? Continuing from the scenario from the Marketing Application feature above, let's say you conducted an experiment to examine how an in-store sampling campaign may influence overall store sales. Column 1 shows the subject number. Column 2 indicates the sample con- dition for the independent variable of whether the subject received a doughnut sample or not. (1 = no sample; 2 = sample). Column 3 indicates the amount of overall sales the subject purchased in the store (in $). Column 4 indicates the subject's rating of hunger upon entering the store (ranging from1 = not at all hungry to 7 = extremely hungry). In-Store Doughnut Sampling Data Subject Number Sample Condition Overall Sales Subject's Rating of Hunger 65 2 1 100 3 1 99 4 2 80 3 23 2 140 7 2 110 8 2 45 2. 2 35 10 1 150 3. 11 1 60 4. 12 178 4 13 200 7 14 12 2 15 2 178 16 2 19 17 2 90 4 18 210 19 1 25 6. 20 1 43 706 User Numbt Sample Condi Overall Salı Subjects Rating of Hunger 65 1 3 100 3 3 99 4 80 3 5 1 23 5 6 140 110 8 45 9. 2 35 4 10 150 3 11 60 4 12 178 4 13 200 14 1 12 178 15 7 16 17 2 19 5 2 90 210 4 18 2 7 19 25 20 1 43 5 21 9. 15 2 22 1 23 89 24 2 260 7 25 190 1= Sample 2= No Sample 1= Not at all hungry 7 = Extremely hungry NNNN 1112 Subject Number Sample Condition Overall Sales Subject's Rating of Hunger 21 2. 22 15 3. 23 2 89 2. 2. 24 260 25 190 5. Your Task Use the Excel file (DT4-1.xlsx) to execute the following analyses: 1. Calculate the amount of sales by the experimental condition. (Recall that this is a cross-tabulation calculation.) Does there appear to be a patrern? 2. Determine whether the presence or absence of the sample impacted overall sales. (To do this, you will need to perform an F-test.) Is the result signifi- cant? What conclusion do you draw from this finding? 3. Calculate the correlations between hunger ratings and overall sales. Is the correlation significant? Is the correlation negative or positive? With this conclusion in hand, speculate on what potential role a person's hunger may play on the results of the experiment. (Hint: this is called moderation.) Draw a graph to show the possible relationship. Use the Excel file (DT4-1.xlsx) to execute the following analyses: 1. Calculate the amount of sales by the experimental condition. (Recall that this is a cross-tabulation calculation.) Does there appear to be a pattern? Continuing from the scenario from the Marketing Application feature above, let's say you conducted an experiment to examine how an in-store sampling campaign may influence overall store sales. Column 1 shows the subject number. Column 2 indicates the sample con- dition for the independent variable of whether the subject received a doughnut sample or not. (1 = no sample; 2 = sample). Column 3 indicates the amount of overall sales the subject purchased in the store (in $). Column 4 indicates the subject's rating of hunger upon entering the store (ranging from1 = not at all hungry to 7 = extremely hungry). In-Store Doughnut Sampling Data Subject Number Sample Condition Overall Sales Subject's Rating of Hunger 65 2 1 100 3 1 99 4 2 80 3 23 2 140 7 2 110 8 2 45 2. 2 35 10 1 150 3. 11 1 60 4. 12 178 4 13 200 7 14 12 2 15 2 178 16 2 19 17 2 90 4 18 210 19 1 25 6. 20 1 43 706 User Numbt Sample Condi Overall Salı Subjects Rating of Hunger 65 1 3 100 3 3 99 4 80 3 5 1 23 5 6 140 110 8 45 9. 2 35 4 10 150 3 11 60 4 12 178 4 13 200 14 1 12 178 15 7 16 17 2 19 5 2 90 210 4 18 2 7 19 25 20 1 43 5 21 9. 15 2 22 1 23 89 24 2 260 7 25 190 1= Sample 2= No Sample 1= Not at all hungry 7 = Extremely hungry NNNN 1112 Subject Number Sample Condition Overall Sales Subject's Rating of Hunger 21 2. 22 15 3. 23 2 89 2. 2. 24 260 25 190 5. Your Task Use the Excel file (DT4-1.xlsx) to execute the following analyses: 1. Calculate the amount of sales by the experimental condition. (Recall that this is a cross-tabulation calculation.) Does there appear to be a patrern? 2. Determine whether the presence or absence of the sample impacted overall sales. (To do this, you will need to perform an F-test.) Is the result signifi- cant? What conclusion do you draw from this finding? 3. Calculate the correlations between hunger ratings and overall sales. Is the correlation significant? Is the correlation negative or positive? With this conclusion in hand, speculate on what potential role a person's hunger may play on the results of the experiment. (Hint: this is called moderation.) Draw a graph to show the possible relationship.
Expert Answer:
Answer rating: 100% (QA)
1 amount of sales by the experimental condition Sample condition 1 2 Total sales 779 ... View the full answer

Posted Date:
Students also viewed these marketing questions
-
Question 3. (MCQ) [2.5] What is the form of the complete partial fractions decomposition of this function: 2x + 1 (x+4) (x 1)(x 3) - B (x+4) Ax+B Cr+D + A. 44+ C. Ar+B (x+4) D. Ar+B (x+4) E. + + ++...
-
Does there appear to be an association between hand span and number of Tootsie Rolls? Describe the direction, form, and strength of the association: Is it positive, negative, weak, strong, linear? Is...
-
Let's suppose you conducted an experiment involving genetic crosses and calculated a chi square value of 1.005. There were four categories of offspring (i.e., the degrees of freedom equaled 3)....
-
For each equation: a) Tell whether the equation describes a parabola, an ellipse, or a hyperbola. b) State whether the directrix is vertical or horizontal and give its location in relation to the...
-
You are provided the following information about Clarke Inc. (Clarke) for 2018: Net income .................. $ 437,500 Accounts receivable on January 1, 2018 ....... 1,375,000 Accounts receivable on...
-
On April 1, The Red Velvet Bakery signed a $8400 bank note with a simple interest rate of 4.5% for 180 days. The company made a partial payment of $2900 on June 1. How much will the bakery owe on the...
-
Corporate annual reports include a letter from the chief executive officer (CEO). The letter highlights achievements and positive results from the past year. If necessary, it delivers news of...
-
Nitric oxide (NO) emissions from automobile exhaust can be reduced by using a catalytic converter, and the following reaction occurs at the catalytic surface: NO + CO N 2 + CO 2 . The concentration...
-
Although there is a popular belief that herbal remedies such as Ginkgo biloba and Ginseng may improve learning and memory in healthy adults, these effects are usually not supported by well-controlled...
-
Pharoah Company uses the percentage-of-receivables basis to record bad debt expense. Accounts receivable (ending balance) $520,000 (debit) Allowance for doubtful accounts (unadjusted) 5,200 (debit)...
-
he following specifications are true about the IEEE802.11n WiFi mode: a. 2.4/5 GHz operation bands, supports up to 600 Mbps data rates, uses HT-OFDM spread spectrum technology, uses SISO radios, and...
-
How to calculate operating cash flow? Is the formula: operating cash flow= net sales- cost of goods- tax always right? Calculating Cash Flows [L02] Quarles Industries had the following operating...
-
Hua is a trader who seeks to minimize any exposure in the portfolio to market beta by pairing a long position in one stock and a short position in a related stock in anticipation that the price...
-
A toy cannon uses a spring to project a 5.29-g soft rubber ball. The spring is originally compressed by 4.97 cm and has a force constant of 7.96 N/m. When the cannon is fired, the ball moves 15.8 cm...
-
1.Miquel Liao invests in a Principal-Protected Note that includes a "participation rate" of 30%. The underlying index was 420 at the time of Miguel's initial investment and was 588 at the time...
-
Lindsey is a freelance advertising copywriter who has contracts with several companies. Her husband, Justin, is an engineer, and all year, he and Lindsey were eligible for a family health insurance...
-
Q10 Carefully explain the concept of implied volatility and its importance for option pricing and, more generally, for market participants. Make sure you illustrate the VIX index.
-
Jax Incorporated reports the following data for its only product. The company had no beginning finished goods inventory and it uses absorption costing. $ 57.30 per unit $ 10.30 per unit $ 7.80 per...
-
Cash larceny involves the fraudulent stealing of an employer's cash. These schemes often target the company's bank deposits. The fraudster steals the money after the deposit has been prepared, but...
-
Describe the four types of data analytics.
-
The corporate social responsibility highlighted in this chapter (see page 585) mentions that Home Depot believes in giving back. One of the ways the company has done this is through its Team Depot...

Study smarter with the SolutionInn App