

Use the income statements and balance sheet statements to perform the following ratio analysis: (a) Liquidity_current...
Fantastic news! We've Found the answer you've been seeking!
Question:
Transcribed Image Text:
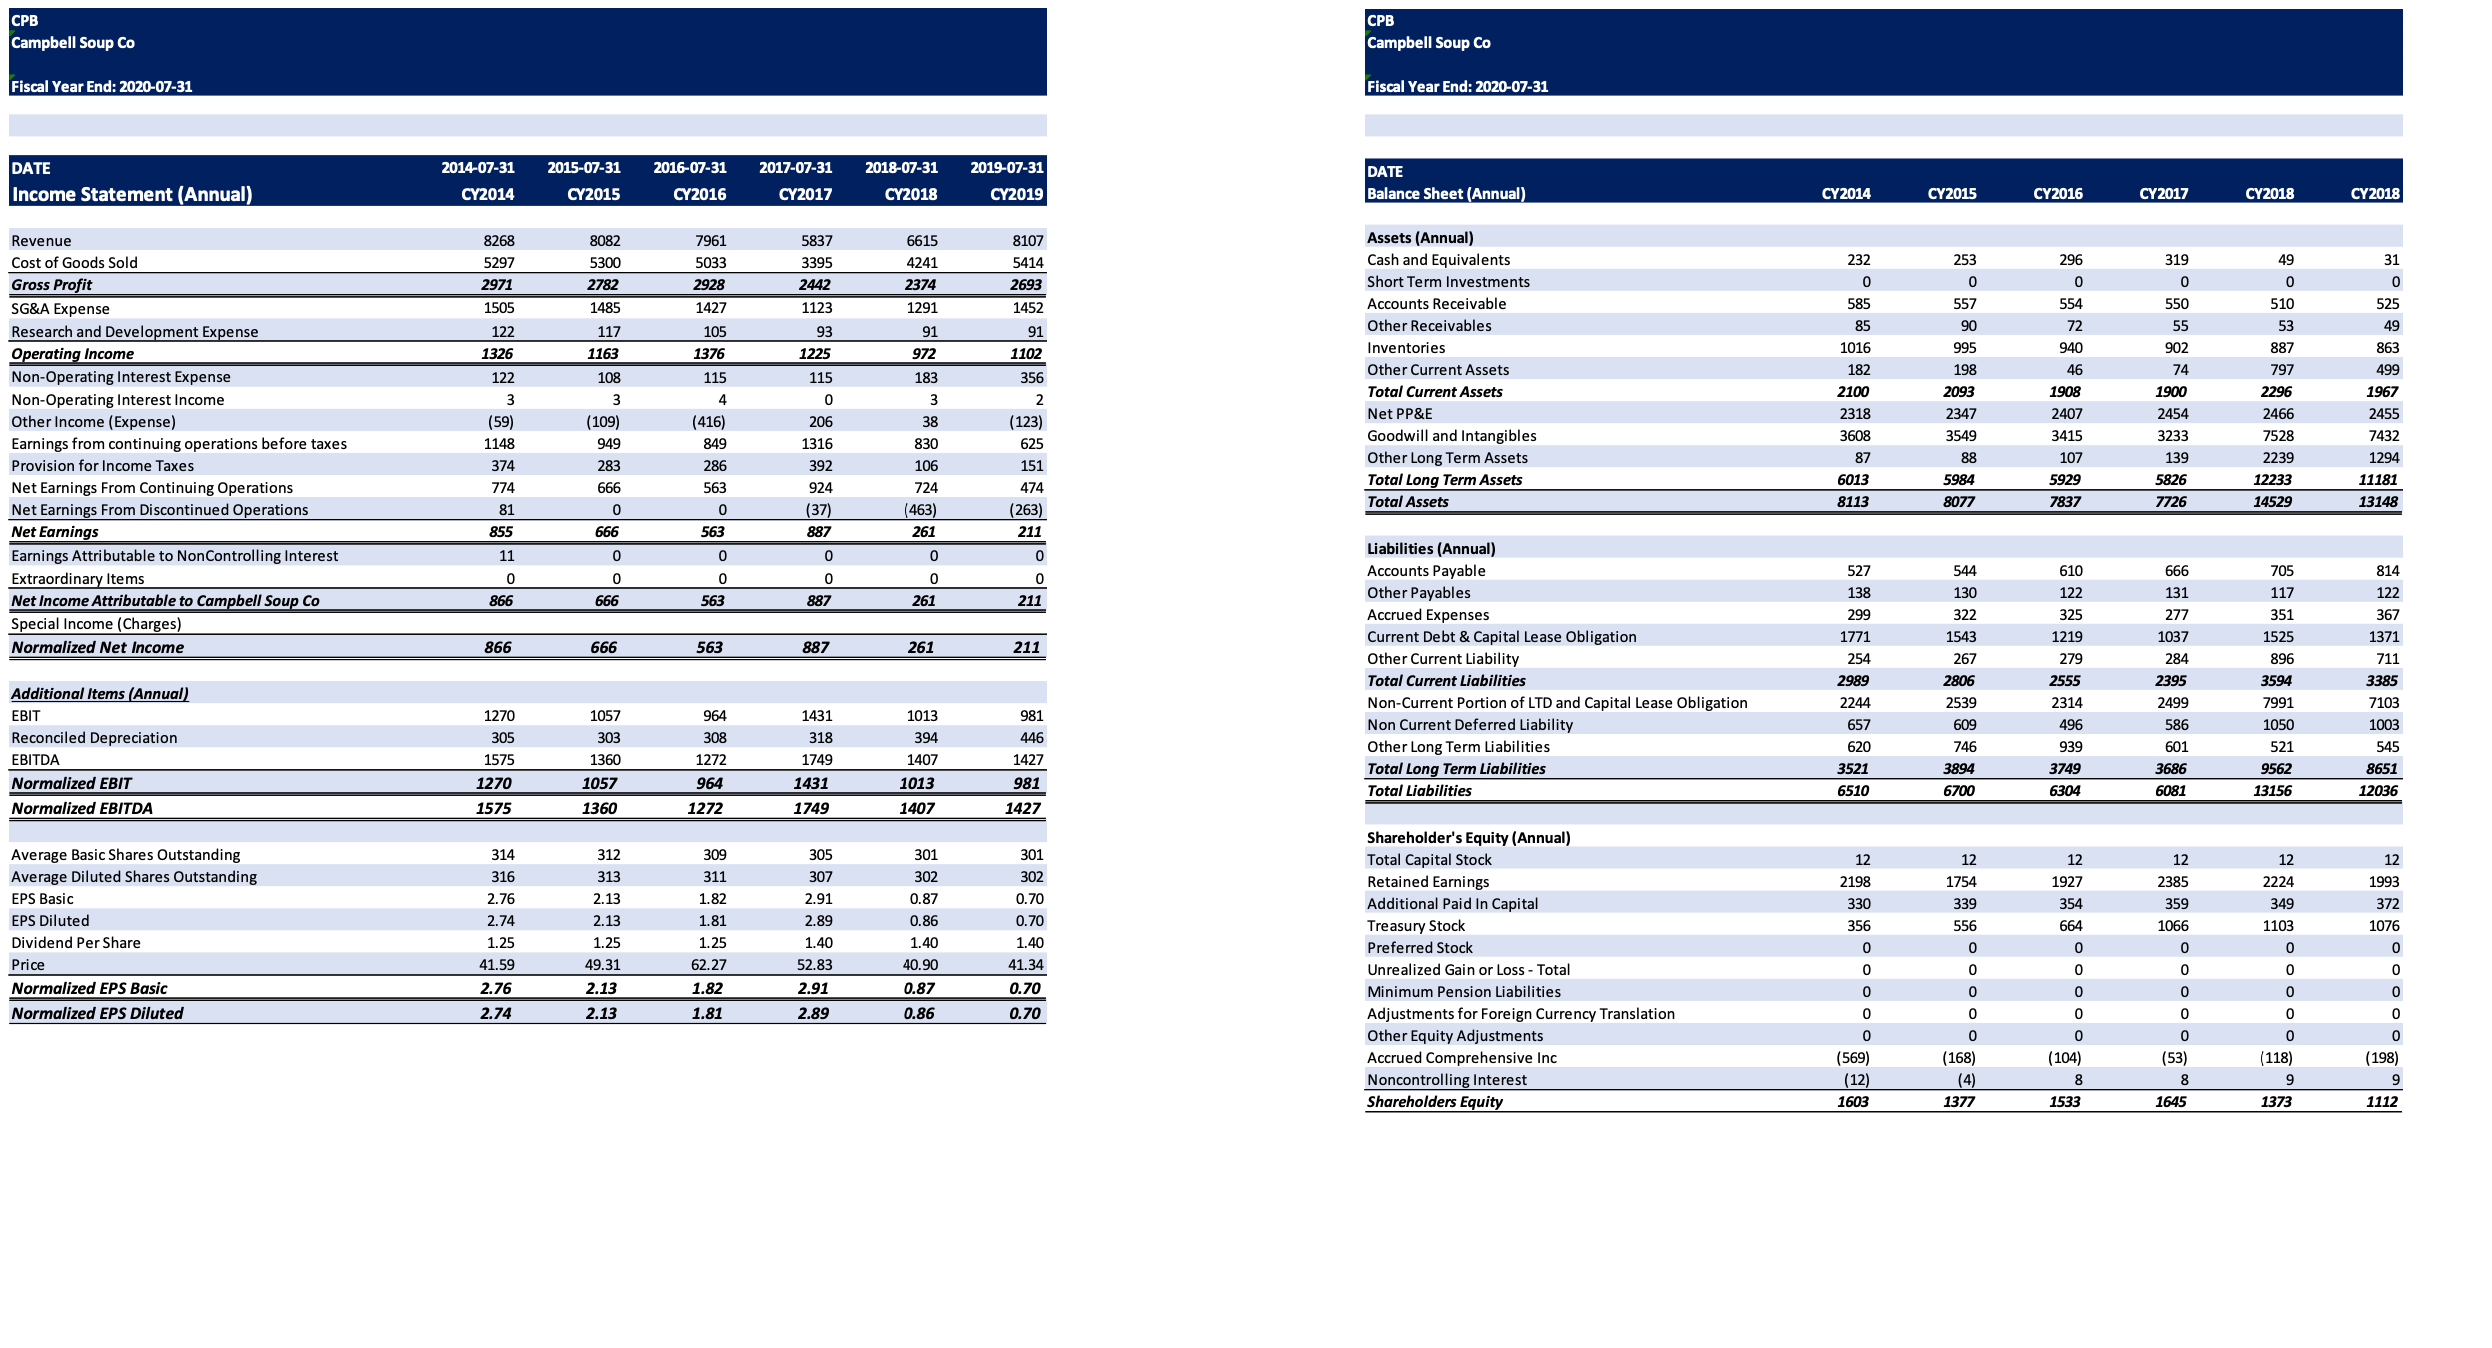
Use the income statements and balance sheet statements to perform the following ratio analysis: (a) Liquidity_current ratio, quick ratio, cash ratio (b) Asset Utilization _ A/R Turnover, Inventory Turnover, DSO, DIO, DPO, Operating Cycle, Cash Conversion Cycle. (c) Solvency Debt to Equity (d) Coverage Times Interest Earned (e) Profitability Profit margin, ROA, ROE (f) Market Metrics_ EPS (basic), P/E CPB Campbell Soup Co Fiscal Year End: 2020-07-31 DATE Income Statement (Annual) Revenue Cost of Goods Sold Gross Profit SG&A Expense Research and Development Expense Operating Income Non-Operating Interest Expense Non-Operating Interest Income Other Income (Expense) Earnings from continuing operations before taxes Provision for Income Taxes Net Earnings From Continuing Operations Net Earnings From Discontinued Operations Net Earnings Earnings Attributable to NonControlling Interest Extraordinary Items Net Income Attributable to Campbell Soup Co Special Income (Charges) Normalized Net Income Additional Items (Annual) EBIT Reconciled Depreciation EBITDA Normalized EBIT Normalized EBITDA Average Basic Shares Outstanding Average Diluted Shares Outstanding EPS Basic EPS Diluted Dividend Per Share Price Normalized EPS Basic Normalized EPS Diluted 2014-07-31 2015-07-31 CY2014 CY2015 8268 5297 2971 1505 122 1326 122 3 (59) 1148 374 774 81 855 11 0 866 866 1270 305 1575 1270 1575 314 316 2.76 2.74 1.25 41.59 2.76 2.74 8082 5300 2782 1485 117 1163 108 3 (109) 949 283 666 0 666 0 0 666 666 1057 303 1360 1057 1360 312 313 2.13 2.13 1.25 49.31 2.13 2.13 2016-07-31 2017-07-31 2018-07-31 CY2018 CY2016 CY2017 7961 5033 2928 1427 105 1376 115 4 (416) 849 286 563 0 563 0 0 563 563 964 308 1272 964 1272 309 311 1.82 1.81 1.25 62.27 1.82 1.81 5837 3395 2442 1123 93 1225 115 0 206 1316 392 924 (37) 887 0 0 887 887 1431 318 1749 1431 1749 305 307 2.91 2.89 1.40 52.83 2.91 2.89 6615 4241 2374 1291 91 972 183 3 38 830 106 724 (463) 261 0 0 261 261 1013 394 1407 1013 1407 301 302 0.87 0.86 1.40 40.90 0.87 0.86 2019-07-31 CY2019 8107 5414 2693 1452 91 1102 356 2 (123) 625 151 474 (263) 211 0 0 211 211 981 446 1427 981 1427 301 302 0.70 0.70 1.40 41.34 0.70 0.70 CPB Campbell Soup Co Fiscal Year End: 2020-07-31 DATE Balance Sheet (Annual) Assets (Annual) Cash and Equivalents Short Term Investments Accounts Receivable Other Receivables Inventories Other Current Assets Total Current Assets Net PP&E Goodwill and Intangibles Other Long Term Assets Total Long Term Assets Total Assets Liabilities (Annual) Accounts Payable Other Payables Accrued Expenses Current Debt & Capital Lease Obligation Other Current Liability Total Current Liabilities Non-Current Portion of LTD and Capital Lease Obligation Non Current Deferred Liability Other Long Term Liabilities Total Long Term Liabilities Total Liabilities Shareholder's Equity (Annual) Total Capital Stock Retained Earnings Additional Paid In Capital Treasury Stock Preferred Stock Unrealized Gain or Loss - Total Minimum Pension Liabilities Adjustments for Foreign Currency Translation Other Equity Adjustments Accrued Comprehensive Inc Noncontrolling Interest Shareholders Equity CY2014 232 0 585 85 1016 182 2100 2318 3608 87 6013 8113 527 138 299 1771 254 2989 2244 657 620 3521 6510 12 2198 330 356 0 0 0 0 0 (569) (12) 1603 CY2015 253 0 557 90 995 198 2093 2347 3549 88 5984 8077 544 130 322 1543 267 2806 2539 609 746 3894 6700 12 1754 339 556 0 0 0 0 0 (168) (4) 1377 CY2016 296 0 554 72 940 46 1908 2407 3415 107 5929 7837 610 122 325 1219 279 2555 2314 496 939 3749 6304 12 1927 354 664 0 0 0 0 0 (104) 8 1533 CY2017 319 0 550 55 902 74 1900 2454 3233 139 5826 7726 666 131 277 1037 284 2395 2499 586 601 3686 6081 12 2385 359 1066 0 0 0 0 0 (53) 8 1645 CY2018 49 0 510 53 887 797 2296 2466 7528 2239 12233 14529 705 117 351 1525 896 3594 7991 1050 521 9562 13156 12 2224 349 1103 0 0 0 0 0 (118) 9 1373 CY2018 31 0 525 49 863 499 1967 2455 7432 1294 11181 13148 814 122 367 1371 711 3385 7103 1003 545 8651 12036 12 1993 372 1076 0 0 0 0 0 (198) 9 1112 Use the income statements and balance sheet statements to perform the following ratio analysis: (a) Liquidity_current ratio, quick ratio, cash ratio (b) Asset Utilization _ A/R Turnover, Inventory Turnover, DSO, DIO, DPO, Operating Cycle, Cash Conversion Cycle. (c) Solvency Debt to Equity (d) Coverage Times Interest Earned (e) Profitability Profit margin, ROA, ROE (f) Market Metrics_ EPS (basic), P/E CPB Campbell Soup Co Fiscal Year End: 2020-07-31 DATE Income Statement (Annual) Revenue Cost of Goods Sold Gross Profit SG&A Expense Research and Development Expense Operating Income Non-Operating Interest Expense Non-Operating Interest Income Other Income (Expense) Earnings from continuing operations before taxes Provision for Income Taxes Net Earnings From Continuing Operations Net Earnings From Discontinued Operations Net Earnings Earnings Attributable to NonControlling Interest Extraordinary Items Net Income Attributable to Campbell Soup Co Special Income (Charges) Normalized Net Income Additional Items (Annual) EBIT Reconciled Depreciation EBITDA Normalized EBIT Normalized EBITDA Average Basic Shares Outstanding Average Diluted Shares Outstanding EPS Basic EPS Diluted Dividend Per Share Price Normalized EPS Basic Normalized EPS Diluted 2014-07-31 2015-07-31 CY2014 CY2015 8268 5297 2971 1505 122 1326 122 3 (59) 1148 374 774 81 855 11 0 866 866 1270 305 1575 1270 1575 314 316 2.76 2.74 1.25 41.59 2.76 2.74 8082 5300 2782 1485 117 1163 108 3 (109) 949 283 666 0 666 0 0 666 666 1057 303 1360 1057 1360 312 313 2.13 2.13 1.25 49.31 2.13 2.13 2016-07-31 2017-07-31 2018-07-31 CY2018 CY2016 CY2017 7961 5033 2928 1427 105 1376 115 4 (416) 849 286 563 0 563 0 0 563 563 964 308 1272 964 1272 309 311 1.82 1.81 1.25 62.27 1.82 1.81 5837 3395 2442 1123 93 1225 115 0 206 1316 392 924 (37) 887 0 0 887 887 1431 318 1749 1431 1749 305 307 2.91 2.89 1.40 52.83 2.91 2.89 6615 4241 2374 1291 91 972 183 3 38 830 106 724 (463) 261 0 0 261 261 1013 394 1407 1013 1407 301 302 0.87 0.86 1.40 40.90 0.87 0.86 2019-07-31 CY2019 8107 5414 2693 1452 91 1102 356 2 (123) 625 151 474 (263) 211 0 0 211 211 981 446 1427 981 1427 301 302 0.70 0.70 1.40 41.34 0.70 0.70 CPB Campbell Soup Co Fiscal Year End: 2020-07-31 DATE Balance Sheet (Annual) Assets (Annual) Cash and Equivalents Short Term Investments Accounts Receivable Other Receivables Inventories Other Current Assets Total Current Assets Net PP&E Goodwill and Intangibles Other Long Term Assets Total Long Term Assets Total Assets Liabilities (Annual) Accounts Payable Other Payables Accrued Expenses Current Debt & Capital Lease Obligation Other Current Liability Total Current Liabilities Non-Current Portion of LTD and Capital Lease Obligation Non Current Deferred Liability Other Long Term Liabilities Total Long Term Liabilities Total Liabilities Shareholder's Equity (Annual) Total Capital Stock Retained Earnings Additional Paid In Capital Treasury Stock Preferred Stock Unrealized Gain or Loss - Total Minimum Pension Liabilities Adjustments for Foreign Currency Translation Other Equity Adjustments Accrued Comprehensive Inc Noncontrolling Interest Shareholders Equity CY2014 232 0 585 85 1016 182 2100 2318 3608 87 6013 8113 527 138 299 1771 254 2989 2244 657 620 3521 6510 12 2198 330 356 0 0 0 0 0 (569) (12) 1603 CY2015 253 0 557 90 995 198 2093 2347 3549 88 5984 8077 544 130 322 1543 267 2806 2539 609 746 3894 6700 12 1754 339 556 0 0 0 0 0 (168) (4) 1377 CY2016 296 0 554 72 940 46 1908 2407 3415 107 5929 7837 610 122 325 1219 279 2555 2314 496 939 3749 6304 12 1927 354 664 0 0 0 0 0 (104) 8 1533 CY2017 319 0 550 55 902 74 1900 2454 3233 139 5826 7726 666 131 277 1037 284 2395 2499 586 601 3686 6081 12 2385 359 1066 0 0 0 0 0 (53) 8 1645 CY2018 49 0 510 53 887 797 2296 2466 7528 2239 12233 14529 705 117 351 1525 896 3594 7991 1050 521 9562 13156 12 2224 349 1103 0 0 0 0 0 (118) 9 1373 CY2018 31 0 525 49 863 499 1967 2455 7432 1294 11181 13148 814 122 367 1371 711 3385 7103 1003 545 8651 12036 12 1993 372 1076 0 0 0 0 0 (198) 9 1112
Expert Answer:
Answer rating: 100% (QA)
To perform ratio analysis using income statements and balance sheet statements we need specific fina... View the full answer

Related Book For 
Financial and Managerial Accounting
ISBN: 978-1439037805
9th edition
Authors: Belverd E. Needles, Marian Powers, Susan V. Crosson
Posted Date:
Students also viewed these finance questions
-
Determine the force P that must be applied to the cord wrapped around the drum at C which is necessary to lift the bucket having a mass m. Note that as the bucket is lifted, the pulley rolls on a...
-
project b initial investments (million)18 perpetual cashflows (million)22 constant growth rate3 therefore irr is1522 discount rate10 growth rate3 npv1343 project c initial investments (million)18...
-
Differentiate between formal and behavioral roles, and describe how behavioral roles emerge during group interaction.
-
An advertising agency has found that when it promotes a new product in a certain market of 350,000, the number of people x who are aware of the product t days after the ad campaign is initiated is...
-
One hundred fifty k mol of an aqueous phosphoric acid solution contains 5.00 mole% H3PO4. The solution is concentrated by adding pure phosphoric acid at a rate of 20.0 L/min. (a) Write a differential...
-
What are the advantages and weaknesses of the CMM (Capability Maturity Model) approach?
-
Fun Ltd., a Texas company, is an expert in the assembly of a variety of video games consoles and they also offer repair parts for these systems. The products range from small handheld consoles that...
-
Let f(x)= == 3x+7x-6 Find the equations of the horizontal asymptotes and the vertical asymptotes of f(x). If there are no asymptotes of a given type, enter 'NONE'. If there is more than one asymptote...
-
Kate Jackson, a new staff accountant, is confused because of the complexities involving accounting standard setting. Specifically, she is confused by the number of bodies issuing financial reporting...
-
what strategy hierarchy level each of the following marketing decisions have most likely been made with explanation why you choose that PepsiCo Strategy Decisions: 1- PepsiCo decides to sell their...
-
The CPM schedule provides a great deal of information that is useful to a construction project manager. What do you believe are the three most useful applications, and why do they top your list?
-
Do you agree or disagree with the Supreme Court's restrictions on the use of the habeas corpus petition? Why?
-
Does an expected value represent the most likely outcome?
-
Discuss an ethical issue in marketing research that relates to each of the following stakeholders: (1) client, (2) the supplier, and (3) the respondent.
-
Visit www.marketresearchcareers.com. What are some of the common career paths in marketing research?
-
The terminal voltage of a battery is higher without circuit than with current carrying circuit connected True False
-
Dr. Chan obtained a $15,000 demand loan at prime plus 1.5% on September 13 from the Bank of Montreal to purchase a new dental X-ray machine. Fixed payments of $700 will be deducted from the dentists...
-
Harbor Restaurant is a large steak restaurant in the suburbs of Detroit. Jake Takas, an accounting student at a nearby college, recently secured a full-time accounting job at the restaurant. He felt...
-
Makay Products Co. is a major consumer goods company that sells over 3,000 products in 135 countries. The companys annual report to the Securities and Exchange Commission presented the following data...
-
On January 1, 2010, Huang Corporation acquired 40 percent of the voting stock of Lee Corporation, an amount sufficient to exercise significant influence over Lee Corporations activities, for...
-
Factor (smart beta) strategy ETFs are least likely to be used by investors: A. to modify portfolio risk. B. for tactical trading purposes. C. to seek outperformance versus a benchmark.
-
Which of the following statements regarding applications of ETFs in portfolio management is correct? A. Equity ETFs tend to be more active than fixed-income ETFs. B. The range of risk exposures...
-
Which of Stosurs statements regarding ETF mechanics is correct? A. Statement 1 B. Statement 2 C. Statement 3 Howie Rutledge is a senior portfolio strategist for an endowment fund. Rutledge meets with...

Study smarter with the SolutionInn App