

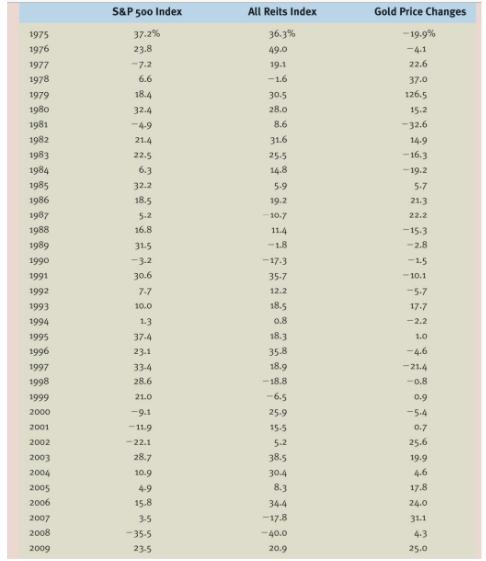
Using a spreadsheet, compute the average return and standard deviation of each of the three asset classes.
Question:
Using a spreadsheet, compute the average return and standard deviation of each of the three asset classes.
Compute the annual return of a portfolio consisting of 50% stocks, 40% real estate, and 10% gold. What are the average return and standard deviation of this portfolio? Also compute the average return and standard deviation of the following portfolios: 75%, 20%, and 5%; and 80%, 5%, and 15%. How do these portfolios perform compared to owning just stocks?
Choose an independent stock from the S&P 500, one that looks promising for you. What are its average return and standard deviation? Look up its Beta, and considering a market premium of 5.6% and a risk-free rate of 3.8%, what is its expected return? Use CAPM
Is this individual stock that you chose better than any of the portfolios from above? What other asset you could have picked to minimize risk? What are your conclusions on this?
Expert Answer:
Using a spreadsheet compute the average return and standard deviation of each of the three asset classes Stocks Average return 1125 Standard Deviation ... View the full answer


Finance Applications and Theory
ISBN: 978-0077861681
3rd edition
Authors: Marcia Cornett, Troy Adair
