

Using d3.js, Produce following plots: 1. Produce a year wise bar chart for the data set, the
Fantastic news! We've Found the answer you've been seeking!
Question:
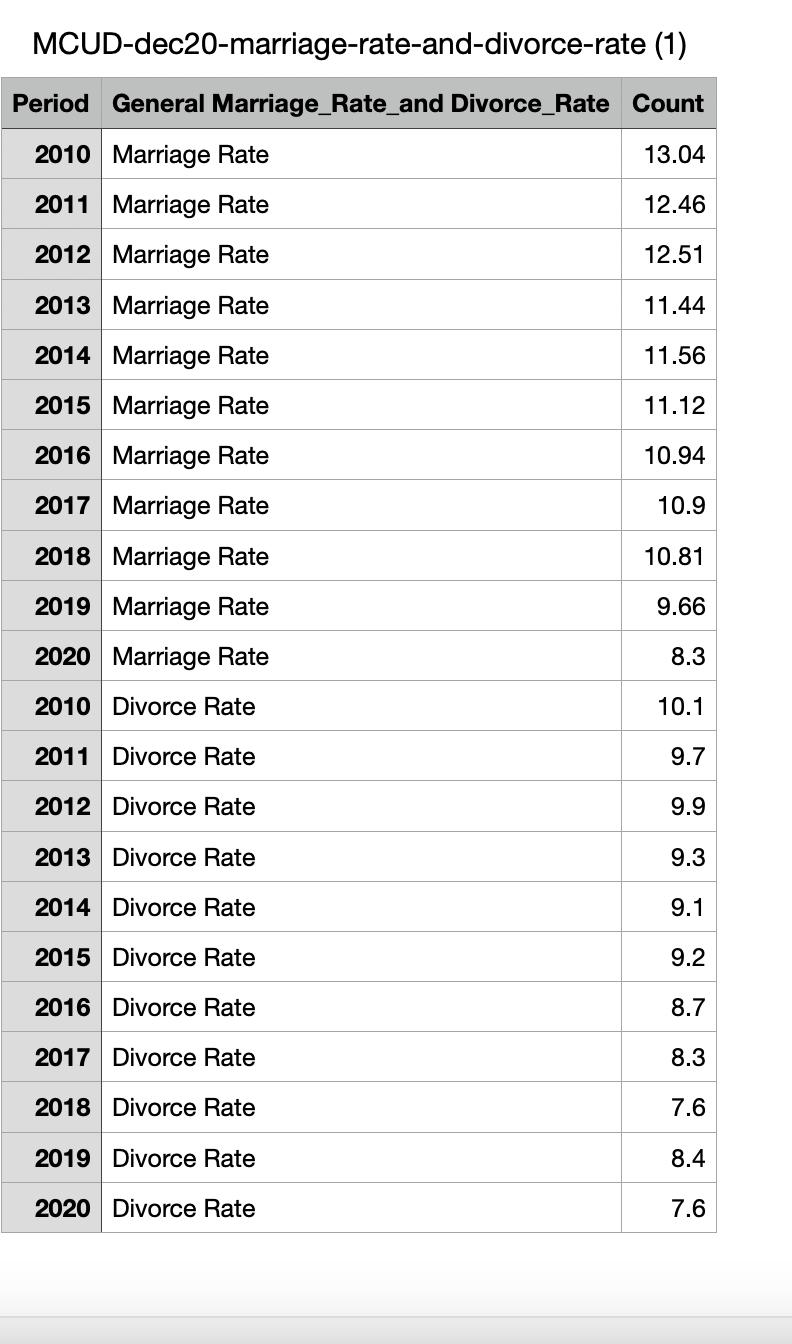
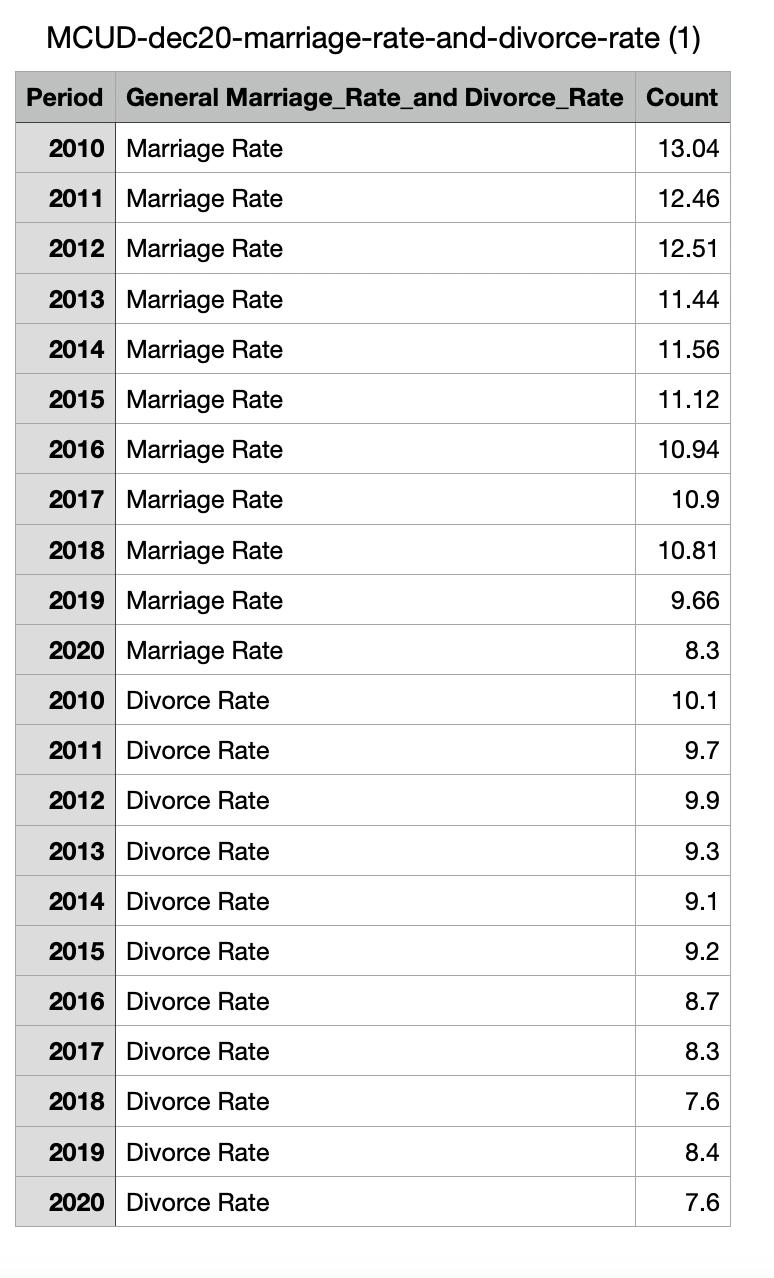
Using d3.js, Produce following plots:
1. Produce a year wise bar chart for the data set, the like we discussed in the class. Highlight year with bold red color if the difference between marriage rate and divorce rate is less than 2
2. Produce a visualization of your choice using the same data. In other words, visualize the data anyway you like. Discuss the task in this case. note file is in CSV
Expert Answer:

Related Book For 

Practicing Statistics Guided Investigations For The Second Course
ISBN: 9780321586018
1st Edition
Authors: Shonda Kuiper, Jeff Sklar
Posted Date:
