

Question: Using DataVisulization Tools in R, create a script that will generate the given outputs. Upload your code. Yearly Numbers of Important Discoveries 12 10
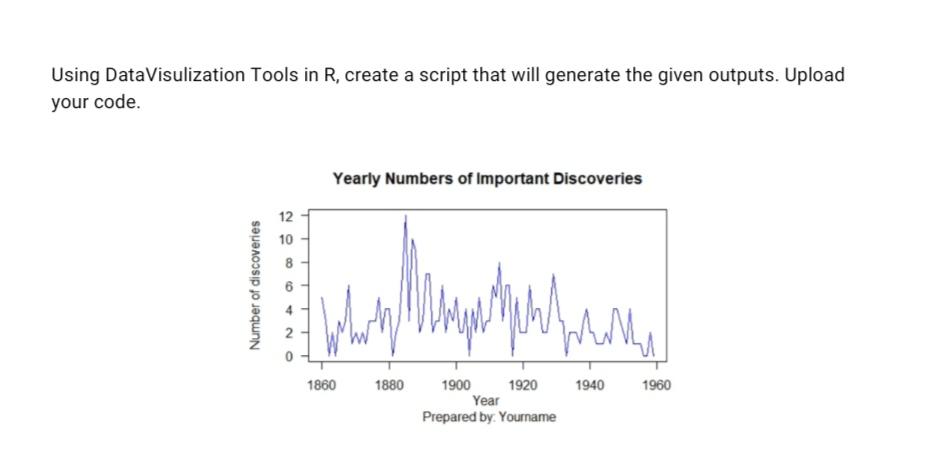
Using DataVisulization Tools in R, create a script that will generate the given outputs. Upload your code. Yearly Numbers of Important Discoveries 12 10 8 I 6 1900 1860 1880 1920 Year Prepared by: Yourname 1940 M 1960
Step by Step Solution
★★★★★
3.44 Rating (154 Votes )
There are 3 Steps involved in it
1 Expert Approved Answer
Step: 1 Unlock

Code to generate this graph requiregraphics plotdiscoveries ylab ... View full answer
Question Has Been Solved by an Expert!
Get step-by-step solutions from verified subject matter experts
Step: 2 Unlock
Step: 3 Unlock