

Using Excel. In no more than 5-6 sentences, address the following: Find an internet site that...
Fantastic news! We've Found the answer you've been seeking!
Question:
Transcribed Image Text:
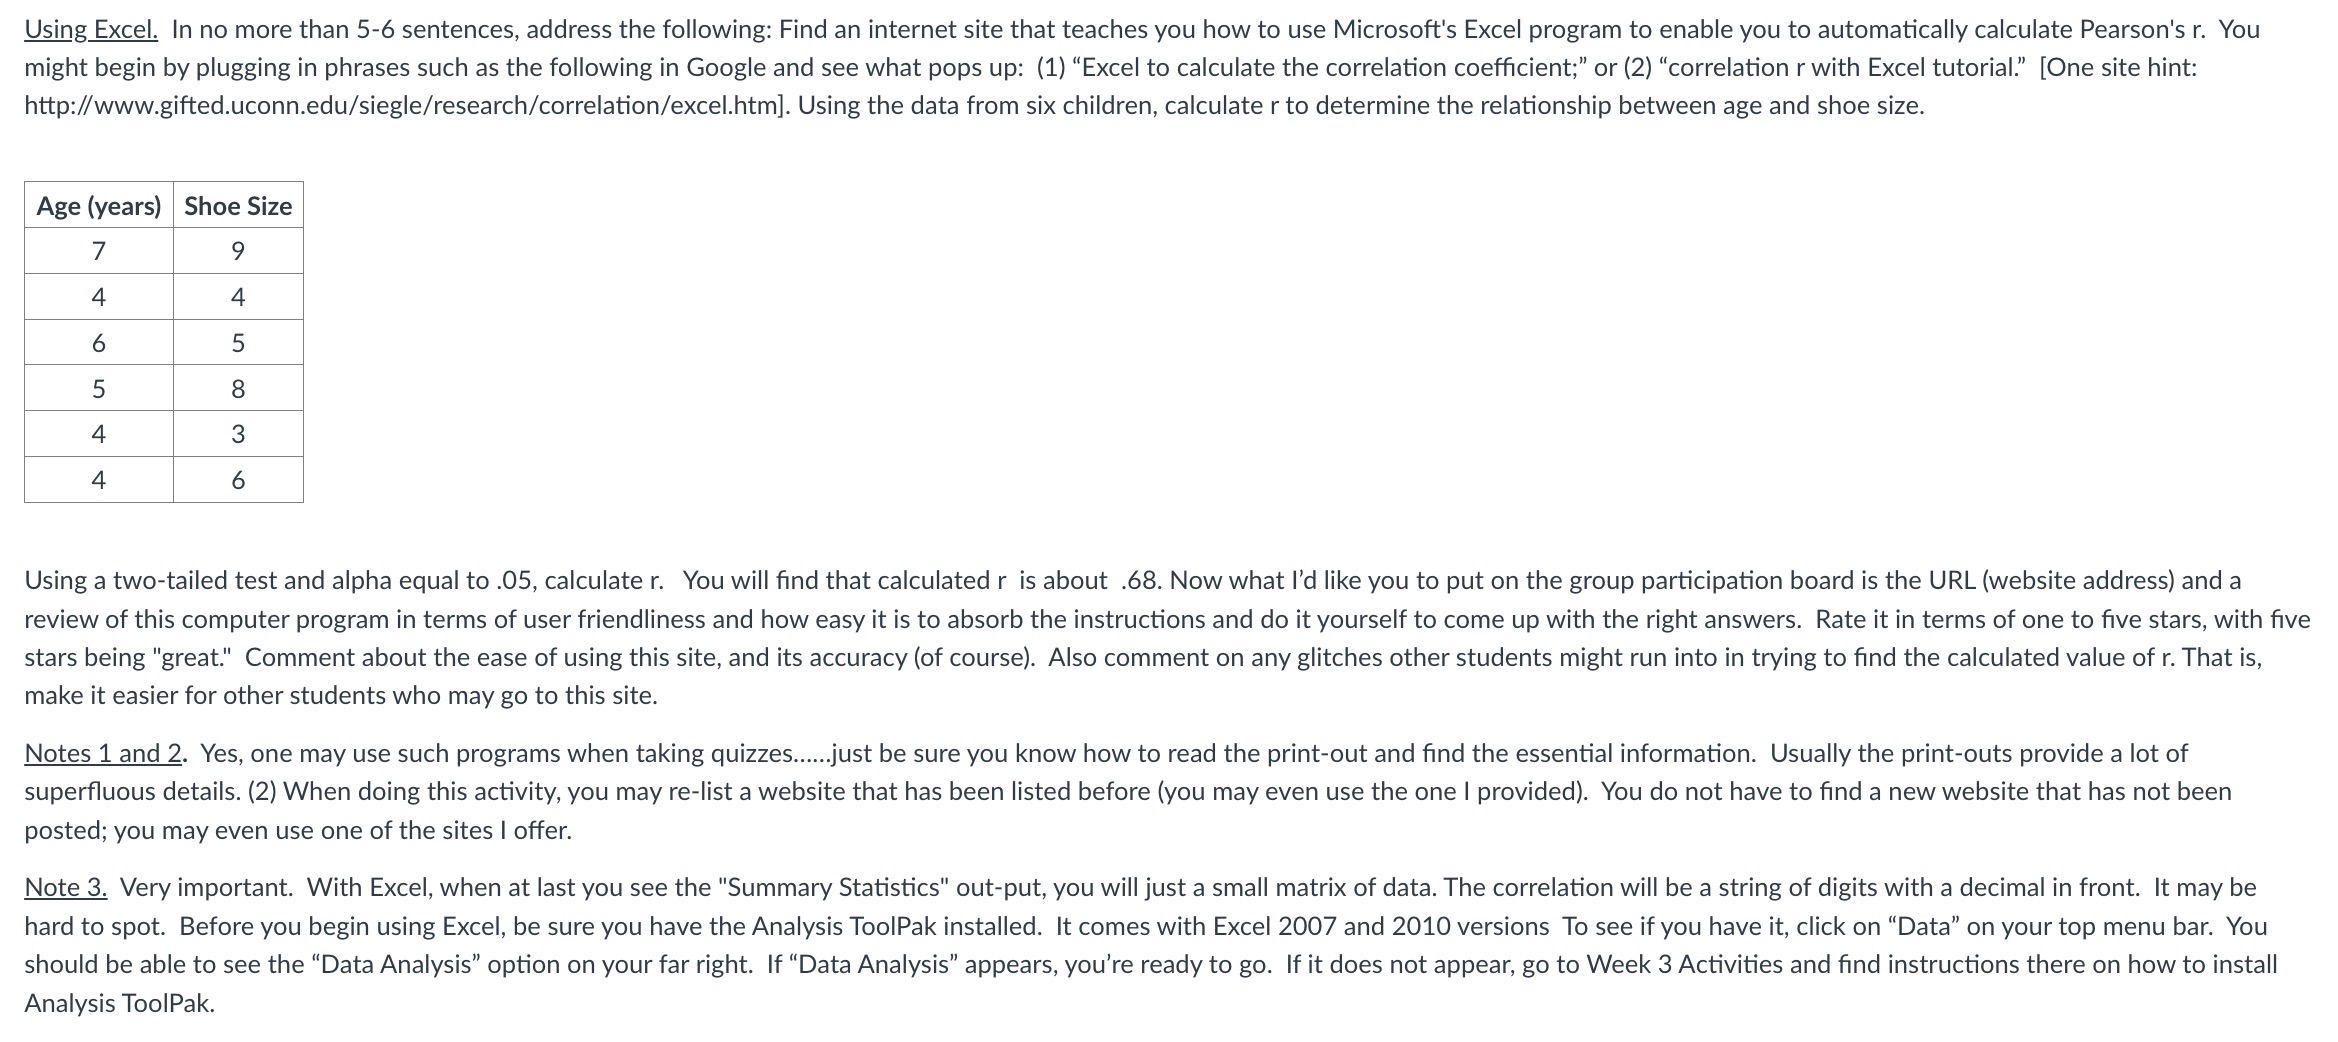
Using Excel. In no more than 5-6 sentences, address the following: Find an internet site that teaches you how to use Microsoft's Excel program to enable you to automatically calculate Pearson's r. You might begin by plugging in phrases such as the following in Google and see what pops up: (1) "Excel to calculate the correlation coefficient;" or (2) "correlation r with Excel tutorial." [One site hint: http://www.gifted.uconn.edu/siegle/research/correlation/excel.htm]. Using the data from six children, calculate r to determine the relationship between age and shoe size. Age (years) Shoe Size 9 7 4 4 6 5 5 00 8 4 4 3 6 Using a two-tailed test and alpha equal to .05, calculate r. You will find that calculated r is about .68. Now what I'd like you to put on the group participation board is the URL (website address) and a review of this computer program in terms of user friendliness and how easy it is to absorb the instructions and do it yourself to come up with the right answers. Rate it in terms of one to five stars, with five stars being "great." Comment about the ease of using this site, and its accuracy (of course). Also comment on any glitches other students might run into in trying to find the calculated value of r. That is, make it easier for other students who may go to this site. Notes 1 and 2. Yes, one may use such programs when taking quizzes......just be sure you know how to read the print-out and find the essential information. Usually the print-outs provide a lot of superfluous details. (2) When doing this activity, you may re-list a website that has been listed before (you may even use the one I provided). You do not have to find a new website that has not been posted; you may even use one of the sites I offer. Note 3. Very important. With Excel, when at last you see the "Summary Statistics" out-put, you will just a small matrix of data. The correlation will be a string of digits with a decimal in front. It may be hard to spot. Before you begin using Excel, be sure you have the Analysis ToolPak installed. It comes with Excel 2007 and 2010 versions To see if you have it, click on "Data" on your top menu bar. You should be able to see the "Data Analysis" option on your far right. If "Data Analysis" appears, you're ready to go. If it does not appear, go to Week 3 Activities and find instructions there on how to install Analysis ToolPak. Using Excel. In no more than 5-6 sentences, address the following: Find an internet site that teaches you how to use Microsoft's Excel program to enable you to automatically calculate Pearson's r. You might begin by plugging in phrases such as the following in Google and see what pops up: (1) "Excel to calculate the correlation coefficient;" or (2) "correlation r with Excel tutorial." [One site hint: http://www.gifted.uconn.edu/siegle/research/correlation/excel.htm]. Using the data from six children, calculate r to determine the relationship between age and shoe size. Age (years) Shoe Size 9 7 4 4 6 5 5 00 8 4 4 3 6 Using a two-tailed test and alpha equal to .05, calculate r. You will find that calculated r is about .68. Now what I'd like you to put on the group participation board is the URL (website address) and a review of this computer program in terms of user friendliness and how easy it is to absorb the instructions and do it yourself to come up with the right answers. Rate it in terms of one to five stars, with five stars being "great." Comment about the ease of using this site, and its accuracy (of course). Also comment on any glitches other students might run into in trying to find the calculated value of r. That is, make it easier for other students who may go to this site. Notes 1 and 2. Yes, one may use such programs when taking quizzes......just be sure you know how to read the print-out and find the essential information. Usually the print-outs provide a lot of superfluous details. (2) When doing this activity, you may re-list a website that has been listed before (you may even use the one I provided). You do not have to find a new website that has not been posted; you may even use one of the sites I offer. Note 3. Very important. With Excel, when at last you see the "Summary Statistics" out-put, you will just a small matrix of data. The correlation will be a string of digits with a decimal in front. It may be hard to spot. Before you begin using Excel, be sure you have the Analysis ToolPak installed. It comes with Excel 2007 and 2010 versions To see if you have it, click on "Data" on your top menu bar. You should be able to see the "Data Analysis" option on your far right. If "Data Analysis" appears, you're ready to go. If it does not appear, go to Week 3 Activities and find instructions there on how to install Analysis ToolPak.
Expert Answer:

Posted Date:
Students also viewed these mathematics questions
-
Explain whether each of the following events represents (i) a shi of the supply curve or (ii) a movement along the supply curve. a. More homeowners put their houses up for sale during a real estate...
-
1. The court held that the Massachusetts statute discriminated against out- of- state wineries by design (intentionally). How can a court determine legislative intent? 2. Suppose that most small...
-
Several years after reengineering its production process, Dettling Corporation hired a new controller, Alana Metzgar. She developed an ABC system very similar to the one used by Dettling's chief...
-
What are two reasons for using a special dividend checking account?
-
Eric Sherm began working as a part-time waiter on April 1, 2013, at Yardville Restaurant. The cash tips of $475 that he received during April were reported on Form 4070, which he submitted to his...
-
Using jquery to apply and remove different styles. The first link removes any existing styles and wrap the content in an unordered list. The third link removes any applied styles and returns to the...
-
An investment of P270,000 can be made in a project that will produce a uniform annual revenue of P185,400 for 5 years and then have a salvage value of 10% of the investment. Out- of pocket costs for...
-
Consider the following method. public static void ifElse Mystery1 (int x, int y) { if (y % x == 0) { y = x + 1; } else { } x += 9; if (x
-
The Street Division of Labrosse Logistics just started operations. It purchased depreciable assets costing $36.5 million and having a four-year expected life, after which the assets can be salvaged...
-
Prepare a list of potential interview questions for you to respond to. Please keep your responses brief (no more than 4-5 lines per question), be straightforward, and address each question as if you...
-
Discussion Board Topic - Campbell Soup Case Study Be prepared to put on your best "customer service voice" for this topic. Please read the attached case study about the Campbell Soup Company's "Label...
-
In her spare time, Zara sketches designs for what she believes to be efficient traffic interchanges . Zara's father runs computer simulations on her designs to model their efficiency. One day, Zara...
-
Research and then discuss the two types of equity found on the balance sheet that contribute to total stockholders equity for the corporation. With respect to rewarding stockholder investment, which...
-
Explain the operation of the dividends received deduction.

Study smarter with the SolutionInn App