

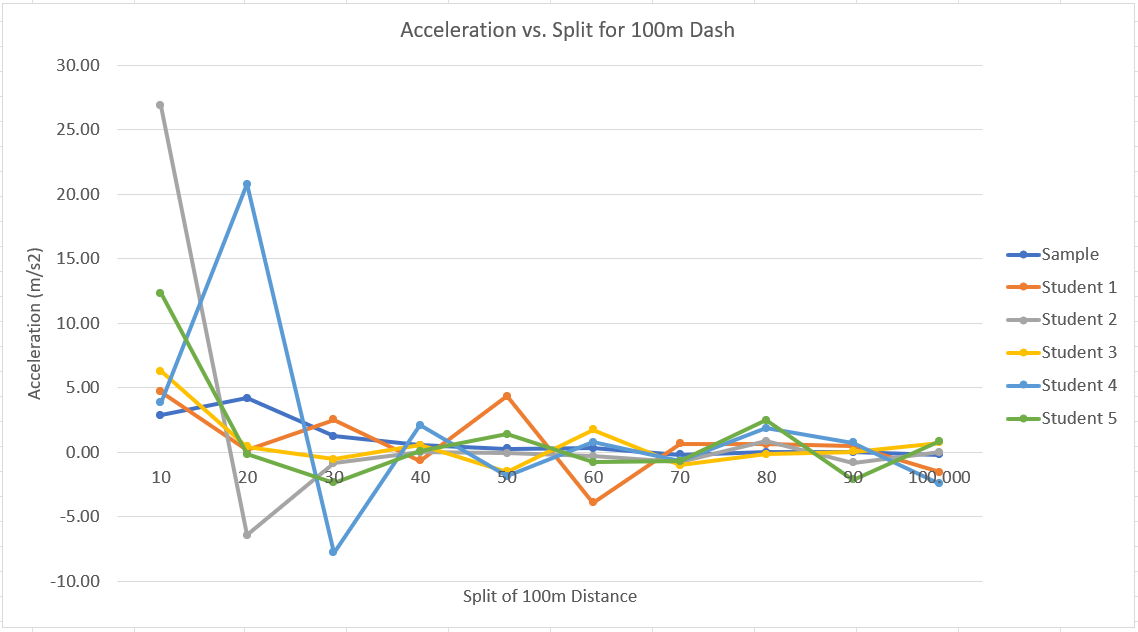
Using Excel template of a 100m dash. The data are plotted as the acceleration over each 10m
No answer yet for this question.
Ask a Tutor
Question:
Using Excel template of a 100m dash. The data are plotted as the acceleration over each 10m increment of the race (i.e., 0m to 10m, 10m to 20m, 20m to 30m, etc.). Based on these data, answer the following (10 points each):
- Describe the general slopes of each split of the graph. Where is acceleration largest?
- What do the negative acceleration values mean?
Expert Answer:

Related Book For 

Posted Date:
