

Question: Using MATLAB, plot on the same graph the bit error probability ( BER ) for selection combining ( SC ) and maximum ratio combining (
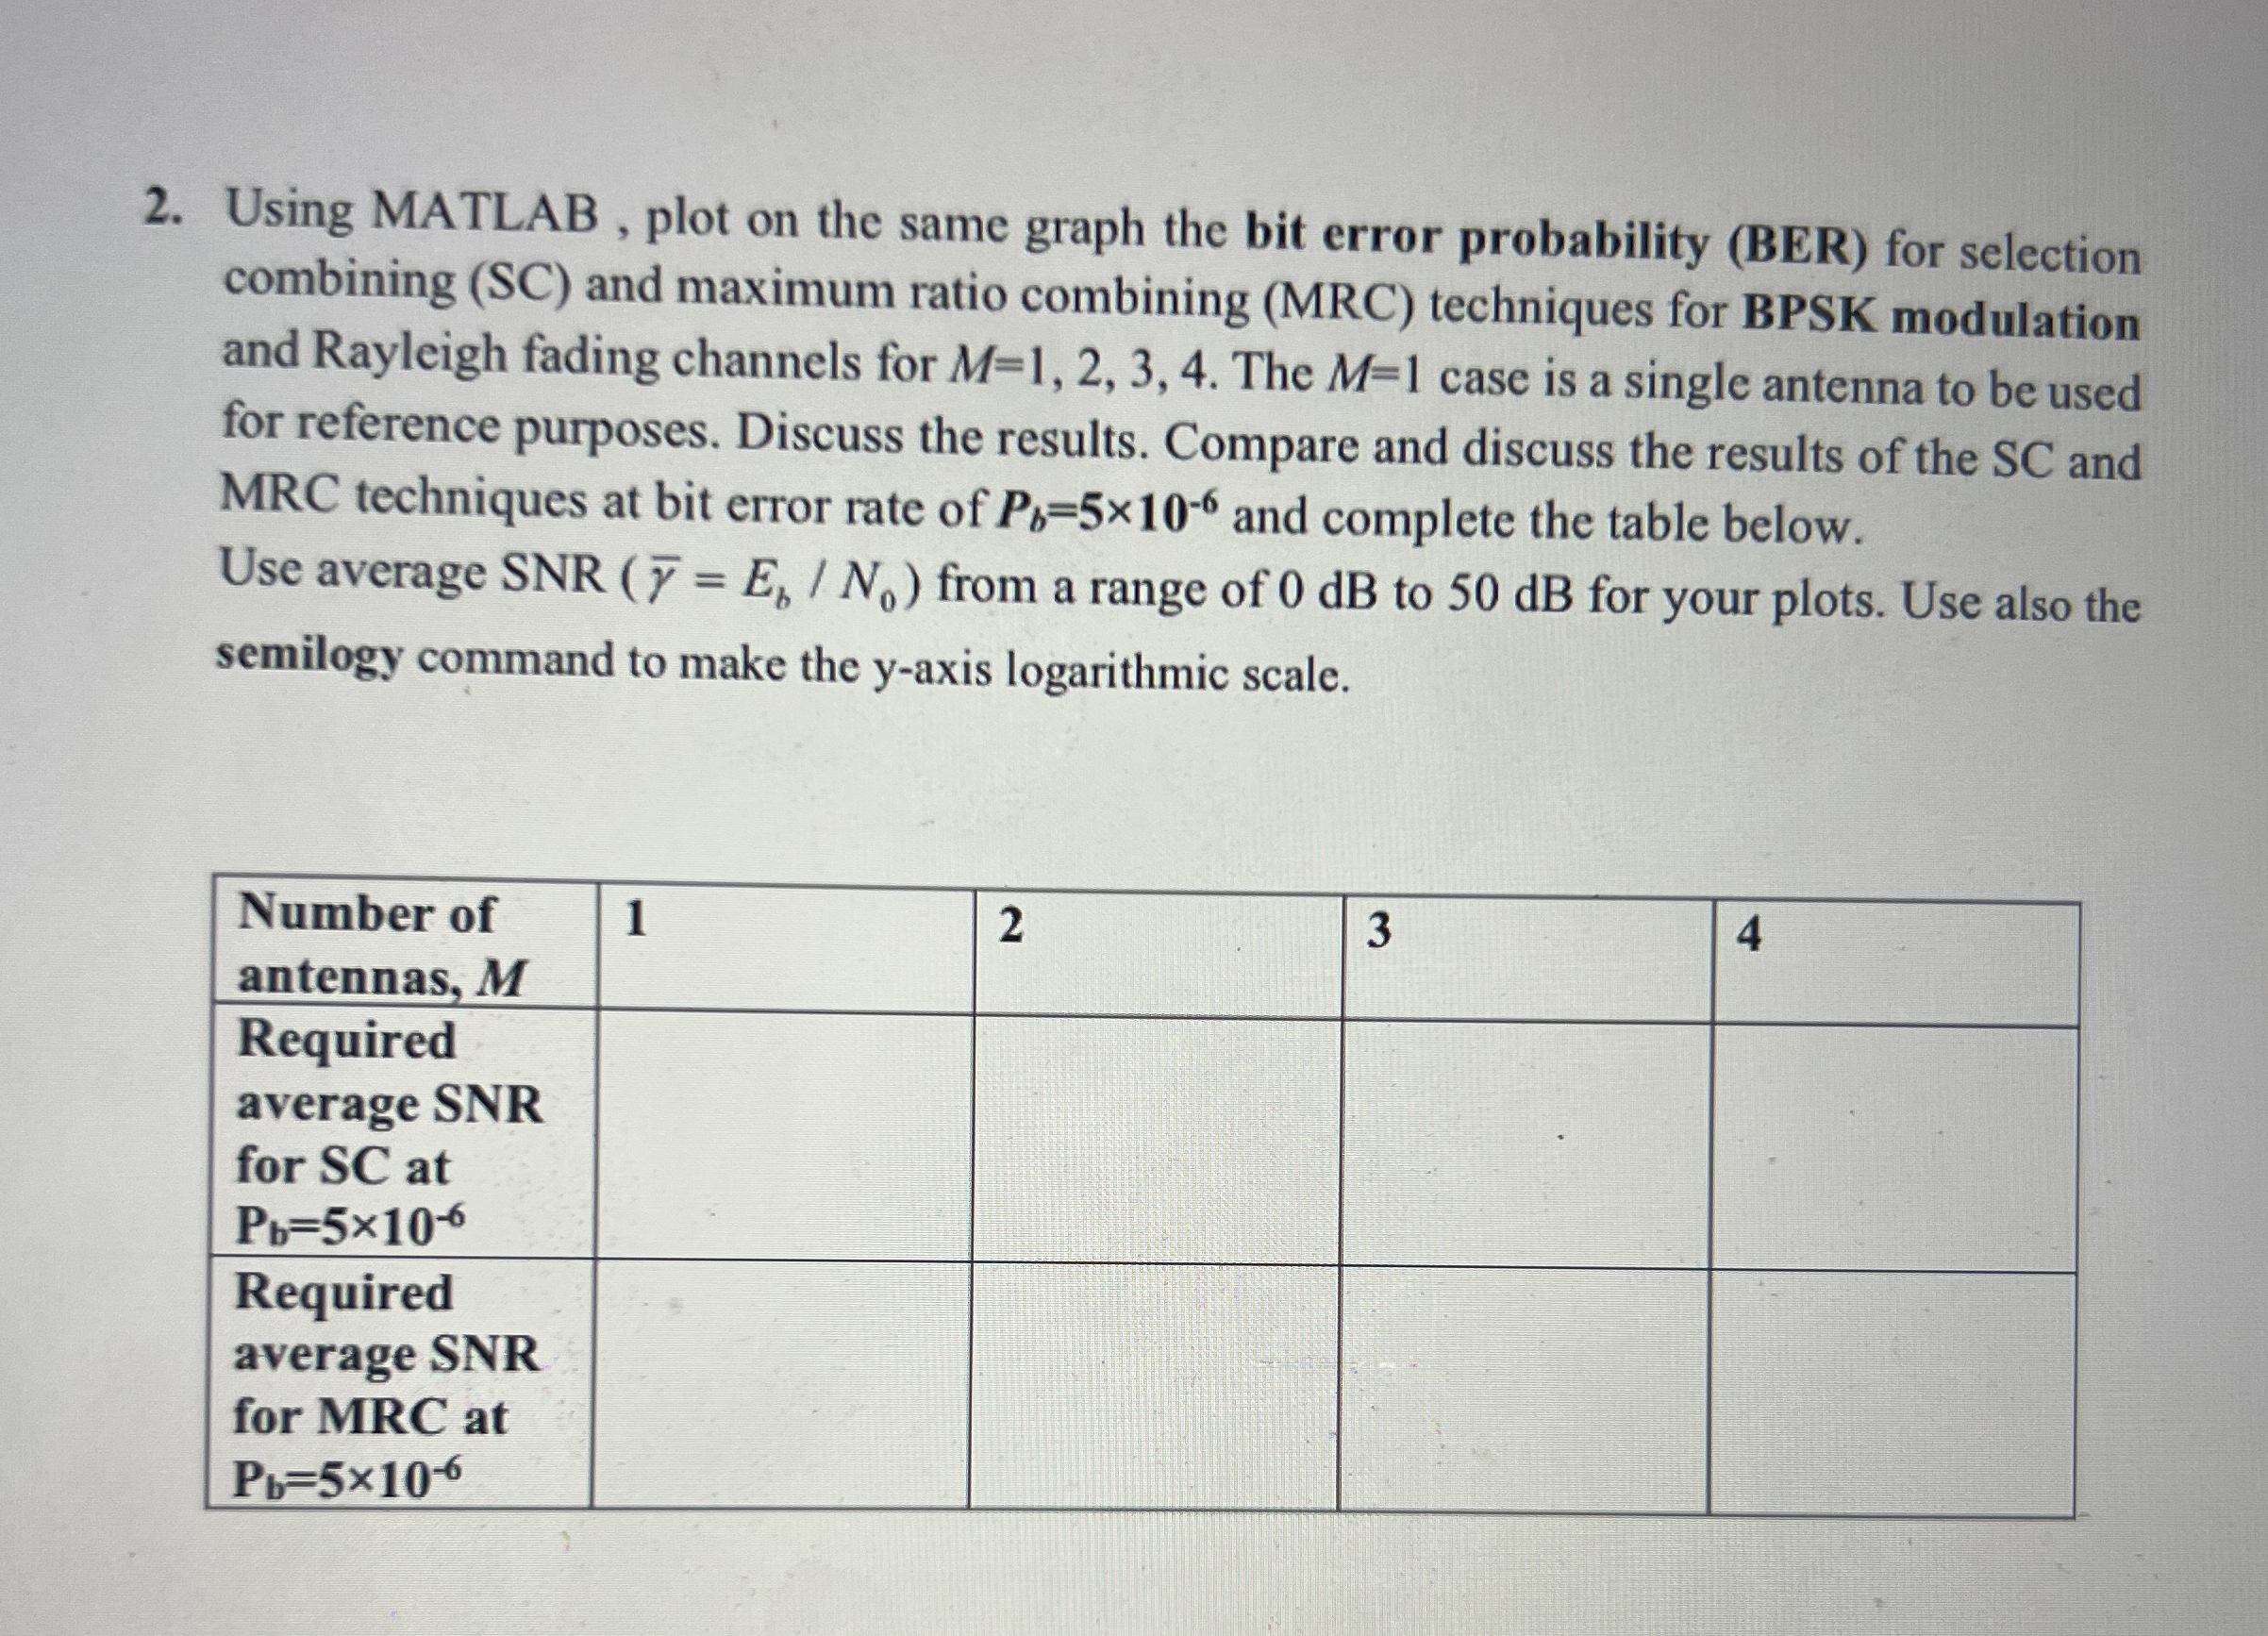
Using MATLAB, plot on the same graph the bit error probability BER for selection combining SC and maximum ratio combining MRC techniques for BPSK modulation and Rayleigh fading channels for The case is a single antenna to be used for reference purposes. Discuss the results. Compare and discuss the results of the SC and MRC techniques at bit error rate of and complete the table below.
Use average from a range of dB to dB for your plots. Use also the semilogy command to make the axis logarithmic scale.
tabletableNumber ofantennas
Write the MATLAB code
Step by Step Solution
There are 3 Steps involved in it
1 Expert Approved Answer
Step: 1 Unlock

Question Has Been Solved by an Expert!
Get step-by-step solutions from verified subject matter experts
Step: 2 Unlock
Step: 3 Unlock