

Q39 Using ratio analysis, common sized percentages, trend analysis and any other relevant metrics, evaluate Target...
Fantastic news! We've Found the answer you've been seeking!
Question:
Transcribed Image Text:
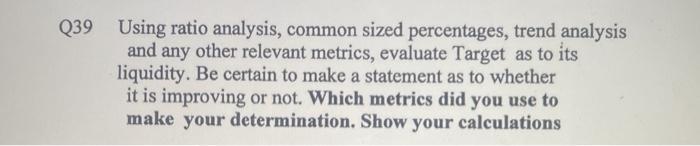
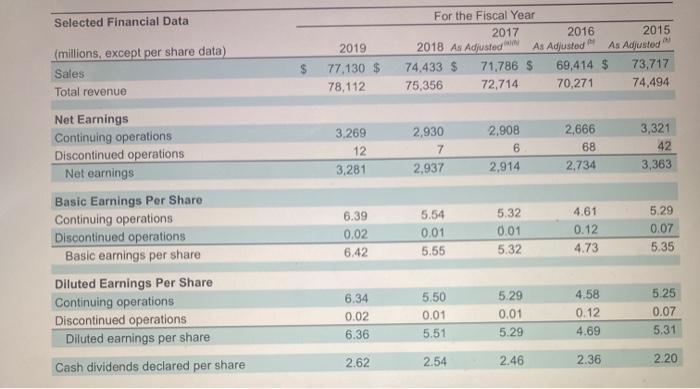
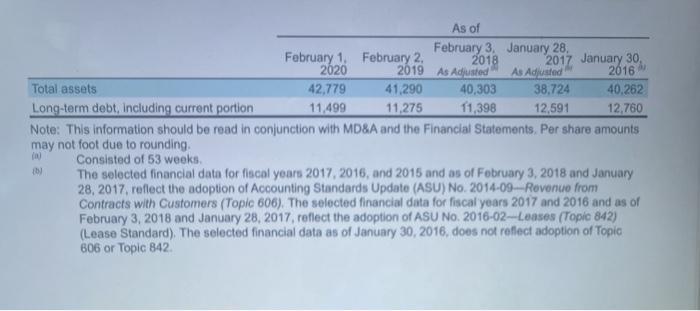
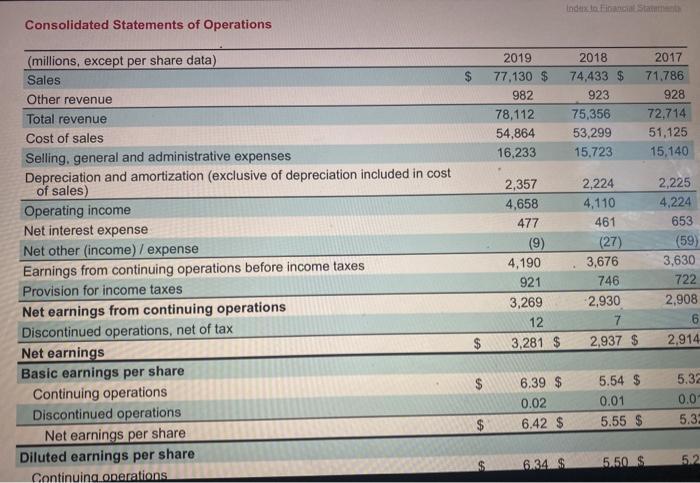
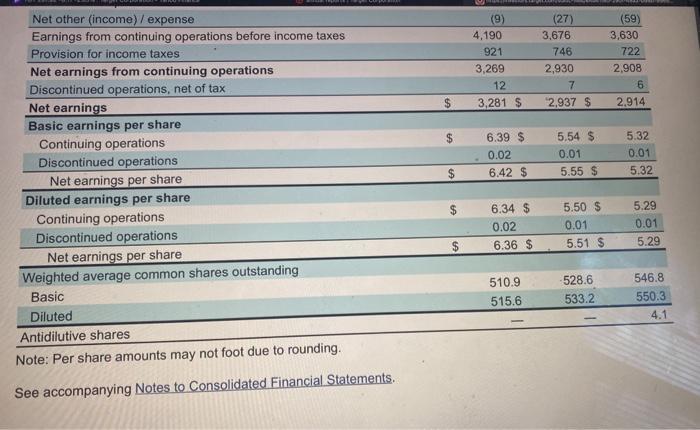
Q39 Using ratio analysis, common sized percentages, trend analysis and any other relevant metrics, evaluate Target as to its liquidity. Be certain to make a statement as to whether it is improving or not. Which metrics did you use to make your determination. Show your calculations Selected Financial Data (millions, except per share data) Sales Total revenue Net Earnings Continuing operations Discontinued operations Net earnings Basic Earnings Per Share Continuing operations Discontinued operations Basic earnings per share Diluted Earnings Per Share Continuing operations Discontinued operations Diluted earnings per share Cash dividends declared per share 2019 77,130 $ 78,112 3,269 12 3,281 6.39 0.02 6.42 6.34 0.02 6.36 2.62 For the Fiscal Year 2017 2015 2016 P 2018 As Adjusted As Adjusted" As Adjusted 74,433 $ 69,414 S 73,717 75,356 70,271 74,494 2,930 7 2,937 5.54 0.01 5.55 5.50 0.01 5.51 2.54 71,786 $ 72,714 2,908 6 2,914 5.32 0.01 5.32 5.29 0.01 5.29 2.46 2,666 68 2,734 4.61 0.12 4.73 4.58 0.12 4.69 2.36 3,321 42 3,363 5.29 0.07 5.35 5.25 0.07 5.31 2.20 February 1, 2020 February 2, 2019 41,290 11,275 As of February 3, January 28, 2018 As Adjusted" 40,303 11,398 2017 January 30, 2016 Total assets 42,779 38,724 40,262 Long-term debt, including current portion 11,499 12,591 12,760 Note: This information should be read in conjunction with MD&A and the Financial Statements. Per share amounts may not foot due to rounding. (0) Consisted of 53 weeks. (b) As Adjusted The selected financial data for fiscal years 2017, 2016, and 2015 and as of February 3, 2018 and January 28, 2017, reflect the adoption of Accounting Standards Update (ASU) No. 2014-09-Revenue from Contracts with Customers (Topic 606). The selected financial data for fiscal years 2017 and 2016 and as of February 3, 2018 and January 28, 2017, reflect the adoption of ASU No. 2016-02-Leases (Topic 842) (Lease Standard). The selected financial data as of January 30, 2016, does not reflect adoption of Topic 606 or Topic 842. Consolidated Statements of Operations (millions, except per share data) Sales Other revenue Total revenue Cost of sales Selling, general and administrative expenses Depreciation and amortization (exclusive of depreciation included in cost of sales) Operating income Net interest expense Net other (income) / expense Earnings from continuing operations before income taxes Provision for income taxes Net earnings from continuing operations Discontinued operations, net of tax Net earnings Basic earnings per share Continuing operations Discontinued operations Net earnings per share Diluted earnings per share Continuing operations $ $ $ 2019 77,130 $ 982 78,112 54,864 16,233 2,357 4,658 477 (9) 4,190 921 3,269 12 3,281 $ 6.39 $ 0.02 6.42 $ 6.34 $ Index to Financial Statements 2018 74,433 $ 923 75,356 53,299 15,723 2,224 4,110 461 (27) 3,676 746 2,930 7 2,937 $ 5.54 $ 0.01 5.55 $ 5.50 $ 2017 71,786 928 72,714 51,125 15,140 2,225 4,224 653 (59) 3,630 722 2,908 6 2,914 5.32 0.01 5.32 Net other (income) / expense Earnings from continuing operations before income taxes Provision for income taxes Net earnings from continuing operations Discontinued operations, net of tax Net earnings Basic earnings per share Continuing operations Discontinued operations Net earnings per share Diluted earnings per share Continuing operations Discontinued operations Net earnings per share Weighted average common shares outstanding Basic Diluted Antidilutive shares Note: Per share amounts may not foot due to rounding. See accompanying Notes to Consolidated Financial Statements. $ $ $ (9) 4,190 921 3,269 12 3,281 S 6.39 $ 0.02 6.42 $ 6.34 $ 0.02 6.36 $ 510.9 515.6 (27) 3,676 746 2,930 7 2,937 $ 5.54 $ 0.01 5.55 $ 5.50 $ 0.01 5.51 528.6 533.2 (59) 3,630 722 2,908 6 2,914 5.32 0.01 5.32 5.29 0.01 5.29 546.8 550.3 4.1 Q39 Using ratio analysis, common sized percentages, trend analysis and any other relevant metrics, evaluate Target as to its liquidity. Be certain to make a statement as to whether it is improving or not. Which metrics did you use to make your determination. Show your calculations Selected Financial Data (millions, except per share data) Sales Total revenue Net Earnings Continuing operations Discontinued operations Net earnings Basic Earnings Per Share Continuing operations Discontinued operations Basic earnings per share Diluted Earnings Per Share Continuing operations Discontinued operations Diluted earnings per share Cash dividends declared per share 2019 77,130 $ 78,112 3,269 12 3,281 6.39 0.02 6.42 6.34 0.02 6.36 2.62 For the Fiscal Year 2017 2015 2016 P 2018 As Adjusted As Adjusted" As Adjusted 74,433 $ 69,414 S 73,717 75,356 70,271 74,494 2,930 7 2,937 5.54 0.01 5.55 5.50 0.01 5.51 2.54 71,786 $ 72,714 2,908 6 2,914 5.32 0.01 5.32 5.29 0.01 5.29 2.46 2,666 68 2,734 4.61 0.12 4.73 4.58 0.12 4.69 2.36 3,321 42 3,363 5.29 0.07 5.35 5.25 0.07 5.31 2.20 February 1, 2020 February 2, 2019 41,290 11,275 As of February 3, January 28, 2018 As Adjusted" 40,303 11,398 2017 January 30, 2016 Total assets 42,779 38,724 40,262 Long-term debt, including current portion 11,499 12,591 12,760 Note: This information should be read in conjunction with MD&A and the Financial Statements. Per share amounts may not foot due to rounding. (0) Consisted of 53 weeks. (b) As Adjusted The selected financial data for fiscal years 2017, 2016, and 2015 and as of February 3, 2018 and January 28, 2017, reflect the adoption of Accounting Standards Update (ASU) No. 2014-09-Revenue from Contracts with Customers (Topic 606). The selected financial data for fiscal years 2017 and 2016 and as of February 3, 2018 and January 28, 2017, reflect the adoption of ASU No. 2016-02-Leases (Topic 842) (Lease Standard). The selected financial data as of January 30, 2016, does not reflect adoption of Topic 606 or Topic 842. Consolidated Statements of Operations (millions, except per share data) Sales Other revenue Total revenue Cost of sales Selling, general and administrative expenses Depreciation and amortization (exclusive of depreciation included in cost of sales) Operating income Net interest expense Net other (income) / expense Earnings from continuing operations before income taxes Provision for income taxes Net earnings from continuing operations Discontinued operations, net of tax Net earnings Basic earnings per share Continuing operations Discontinued operations Net earnings per share Diluted earnings per share Continuing operations $ $ $ 2019 77,130 $ 982 78,112 54,864 16,233 2,357 4,658 477 (9) 4,190 921 3,269 12 3,281 $ 6.39 $ 0.02 6.42 $ 6.34 $ Index to Financial Statements 2018 74,433 $ 923 75,356 53,299 15,723 2,224 4,110 461 (27) 3,676 746 2,930 7 2,937 $ 5.54 $ 0.01 5.55 $ 5.50 $ 2017 71,786 928 72,714 51,125 15,140 2,225 4,224 653 (59) 3,630 722 2,908 6 2,914 5.32 0.01 5.32 Net other (income) / expense Earnings from continuing operations before income taxes Provision for income taxes Net earnings from continuing operations Discontinued operations, net of tax Net earnings Basic earnings per share Continuing operations Discontinued operations Net earnings per share Diluted earnings per share Continuing operations Discontinued operations Net earnings per share Weighted average common shares outstanding Basic Diluted Antidilutive shares Note: Per share amounts may not foot due to rounding. See accompanying Notes to Consolidated Financial Statements. $ $ $ (9) 4,190 921 3,269 12 3,281 S 6.39 $ 0.02 6.42 $ 6.34 $ 0.02 6.36 $ 510.9 515.6 (27) 3,676 746 2,930 7 2,937 $ 5.54 $ 0.01 5.55 $ 5.50 $ 0.01 5.51 528.6 533.2 (59) 3,630 722 2,908 6 2,914 5.32 0.01 5.32 5.29 0.01 5.29 546.8 550.3 4.1
Expert Answer:

Related Book For 

Posted Date:
Students also viewed these accounting questions
-
The Starlight, Inc. financial statements for the fiscal year ended June 30, 2013, are presented below. The firm's sales are projected to grow at a rate of 20 percent next year, and all financial...
-
Our controller, Tommy Swain is negotiating with potential new Wood suppliers in Kentucky. We need the Large Box Car Division's Master Budget for the fiscal year ended June 30, 2021 for our corporate...
-
Selected accounts and related amounts for Kanpur Co. for the fiscal year ended June 30, 2019, are shown below. Cash $92,000 Gerri Faber, Drawing $300,000 Accounts Receivable 450,000 Sales 8,925,000...
-
Describes 7shifts' pioneering role in revolutionizing restaurant management through cloud-based solutions.
-
What conditions must be satisfied if resources are used efficiently?
-
The management of a corporation wishes to improve the appearance of its current financial position as reflected in the current and quick ratios. Required: a. Describe four ways in which management...
-
Estimate the overall odds ratio of the set of tables in Problem3.6 and test whether the odds ratios are the same across the tables. Problem3.6 is: 3.6 Use the DOS data to test whether there is gender...
-
Multiple Choice Questions 1. You are taking a multiple-choice test that awards you one point for a correct answer and penalizes you 0.25 points for an incorrect answer. If you have to make a random...
-
1.) Pineapple Inc. issued a common stock for $30,000 and ended the period with net cash from financing of -$5,000. If the only other financing company was a payment of cash dividend, what is the...
-
This problem asks you to analyze the capital structure of HCA, Inc., the largest private operator of health care facilities in the world. In 2006, a syndicate of private equity firms acquired the...
-
28,000 $1000 bonds with a stated rate of 2.5% and interest payments due semi-annually to be issued with ten detachable warrants each. The debt matures in 10 years. The bonds without the warrants...
-
How does the ecological rationality view of human decision making differ from the heuristics and biases view? In what ways are the two views consistent, or at least similar?
-
A company is trying to estimate the first-year cash flow (at Year 1) for a proposed project. The financial staff has collected the following information on the project: Sales Optg costs (Excluding...
-
Question 1 Identify 3 ( three) risk categories and describe potential project risks in those categories. Question 2 What are the key components of a risk management plan? Question 3 What are project...
-
5. Find the labor force participation rate and unemployment rate given the following information about an economy: Population (working age) 120 Labor Force 80 # Employed 70...
-
3) Considering the following block diagram of a counter: CLK J K Q Qo a. What kind of triggering is used?? clock K Q' b. With the aid of timing diagram clar the sequence of the states Qo,Q that is...
-
3. Find the constant term in the expansion of (a) (z + ) * 5 (c) (3x 7x 4 9 2 5x (b) (3x 5) (d) (1 - 2 +2) (32-7953) 7x - 6
-
Refer to Exercise 8.S.I. Construct a scatterplot of the data. Does the appearance of the scatterplot indicate that the pairing was effective? Explain. Exercise 8.S.I. A volunteer working at an animal...
-
What are the vision, mission, and values of Better World Books? Critically evaluate their usefulness to the company's leaders in formulating strategic intent.
-
How might BWB differentiate its product and services to create a strategic competitive advantage?
-
Jeff Immelt became CEO and chairman of GE on September 7, 2001. Analyze GE's external environment since 2001 using PESTEL and discuss the effects these changes have had on GE. Is Immelt responsible...
-
True or False: Engineers seldom have an opportunity to influence the recovery period for expenditures.
-
A lumber company purchases and installs a wood chipper for \(\$ 200,000\). The chipper is classified as MACRS 7-year property. Its useful life is 10 years. The estimated salvage value at the end of...
-
True or False: Straight-line depreciation is the most popular depreciation method used in financial reporting.

Study smarter with the SolutionInn App