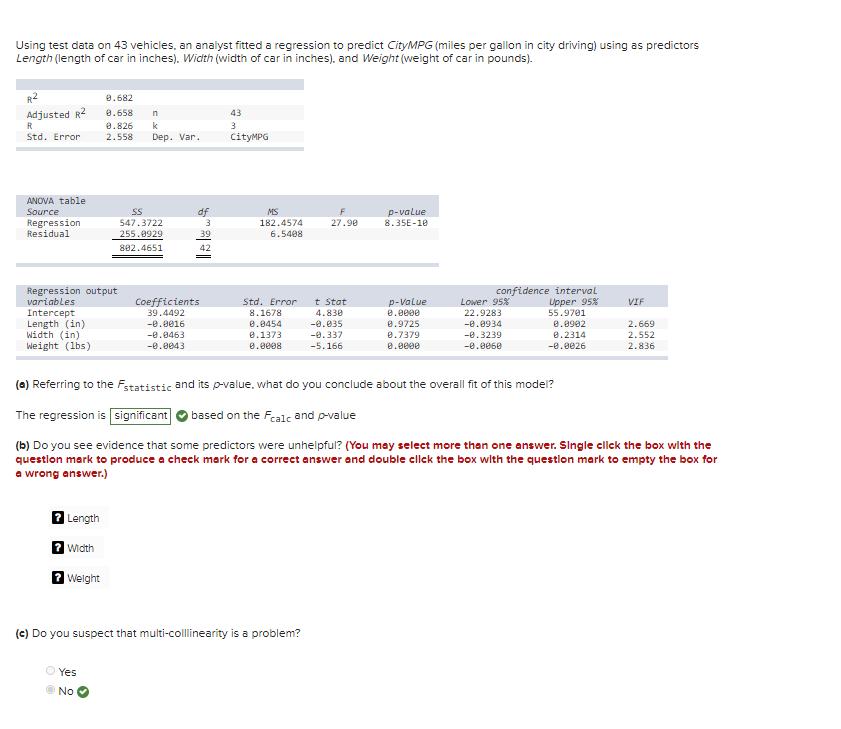
Using test data on 43 vehicles, an anaiyst fitted a regression to predict CityMPG (miles per...
Fantastic news! We've Found the answer you've been seeking!
Question:
Transcribed Image Text:
Using test data on 43 vehicles, an anaiyst fitted a regression to predict CityMPG (miles per gallon in city driving) using as predictors Length (length of car in inches). Width (width of car in inches), and Weight (weight of car in pounds). R2 8.682 Adjusted R2 0.658 43 n 0.826 k 3 Std. Error 2.558 Dep. Var. CityMPG ANOVA table SS df MS p-value 8.35E-10 Source Regression Residual 547.3722 182.4574 27.90 255.0929 39 6.5408 802.4651 42 confidence interval Upper 95% 55.9701 0.8902 8.2314 Regression output variables Coefficients 39.4492 t Stat 4.830 -0.035 Std. Error p-Value e.ee00 Lower 95% 22.9283 -0.0934 VIF Intercept Length (in) Width (in) Weight (1bs) 8.1678 0.0454 0.9725 8.7379 -0.0016 2.669 -0.0463 0.1373 -0.337 -0.3239 2.552 -0.0043 0.0008 -5.166 0.0e0e -0.8060 -e.0026 2.836 (a) Referring to the Fstatistic and its p-value, what do you conclude about the overall fit of this model? The regression is significant based on the Fcalc and p-value (b) Do you see evidence that some predictors were unhelpful? (You may select more than one answer. Single cllck the box with the questlon mark to produce a check mark for a correct answer and double click the box with the questlon mark to empty the box for a wrong answer.) 7 Length 2 Width 2 Welght (c) Do you suspect that multi-colllinearity is a problem? Yes No Using test data on 43 vehicles, an anaiyst fitted a regression to predict CityMPG (miles per gallon in city driving) using as predictors Length (length of car in inches). Width (width of car in inches), and Weight (weight of car in pounds). R2 8.682 Adjusted R2 0.658 43 n 0.826 k 3 Std. Error 2.558 Dep. Var. CityMPG ANOVA table SS df MS p-value 8.35E-10 Source Regression Residual 547.3722 182.4574 27.90 255.0929 39 6.5408 802.4651 42 confidence interval Upper 95% 55.9701 0.8902 8.2314 Regression output variables Coefficients 39.4492 t Stat 4.830 -0.035 Std. Error p-Value e.ee00 Lower 95% 22.9283 -0.0934 VIF Intercept Length (in) Width (in) Weight (1bs) 8.1678 0.0454 0.9725 8.7379 -0.0016 2.669 -0.0463 0.1373 -0.337 -0.3239 2.552 -0.0043 0.0008 -5.166 0.0e0e -0.8060 -e.0026 2.836 (a) Referring to the Fstatistic and its p-value, what do you conclude about the overall fit of this model? The regression is significant based on the Fcalc and p-value (b) Do you see evidence that some predictors were unhelpful? (You may select more than one answer. Single cllck the box with the questlon mark to produce a check mark for a correct answer and double click the box with the questlon mark to empty the box for a wrong answer.) 7 Length 2 Width 2 Welght (c) Do you suspect that multi-colllinearity is a problem? Yes No
Expert Answer:
Related Book For
Applied Statistics in Business and Economics
ISBN: 978-0073521480
4th edition
Authors: David Doane, Lori Seward
Posted Date:
Students also viewed these mathematics questions
-
Using test data on 43 vehicles, an analyst fitted a regression to predict CityMPG (miles per gallon in city driving) using as predictors Length (length of car in inches), Width (width of car in...
-
In Exercise 5, we saw a regression to predict the sales per person at a movie theater in terms of the time (in minutes) before the show. The model was: Sales = 4.3 + 0.265 Minutes. a) A 90%...
-
A local trucking company fitted a regression to relate the travel time (days) of its shipments as a function of the distance traveled (miles). The fitted regression is Time = -7.126 + 0.0214...
-
Perform computational experiments to verify that the average path length in a ring graph on \(V\) vertices is \(\sim 1 / 4 V\). Then, repeat these experiments, but add one random edge to the ring...
-
Suppose an economys productivity growth rate increases, causing the prices of its exports to fall, the quantity of its exports to rise, and its current account balance to move from a deficit to a...
-
What major factors influence the choice of individual media vehicles?
-
Explain the differences between a contingency fee agreement, flat fee agreement, and hourly rate agreement.
-
On August 1, 2010, Christy Co. treasurer signed a note promising to pay $121,500 on December 31, 2010. The proceeds of the note were $114,000.00 rev: 05-10-2011 19.value: 15.00 points You did NOT...
-
Despite the undeniable upsides of social networking, social media sites track users and sell their information. Savvy business communicators can protect themselves with the following safeguards:...
-
The Onenote Co. produces a single product at three plants for four customers. The three plants will produce 60, 80, and 40 units, respectively, during the next time period. The firm has made a...
-
Radcliffe Brown considers sociology as a science of (a) human relationship (b) human society (c) human behaviour (d) human interaction
-
List and briefly explain the different types of taxes which any business firm has to deal with.
-
Briefly explain the product life cycle, and why is it important in marketing?
-
How would you explain the concept of total products? And what are the necessary conditions in its application?
-
When did the bulk of employment legislations pass? List the most important 10 of them.
-
A study was conducted to investigate the relationship between severe headaches and being left- or right-handed. (Incidentally, Lisa Kudrow, who played Phoebe Buffay on the hit sitcom "Friends," is an...
-
Vietnam is a large rice producer. The market has recently been affected by two events: (i) Urban growth has decreased the amount of land available for growing rice; (ii) The state has increased its...
-
Representative data read from a plot that appeared in the paper Effect of Cattle Treading on Erosion from Hill Pasture: Modeling Concepts and Analysis of Rainfall Simulator Data (Australian Journal...
-
An experimental bumper was designed to reduce damage in low-speed collisions. This bumper was installed on an experimental group of vans in a large feet, but not on a control group. At the end of a...
-
Suggest both a Likert scale question and a response scale to measure the following: a. A students rating of a particular statistics professor. b. A voters satisfaction with the presidents economic...
-
Below are fitted regressions for Y = asking price of a used vehicle and X = the age of the vehicle. The observed range of X was 1 to 8 years. The sample consisted of all vehicles listed for sale in a...
-
Optimize the following Boolean functions \(F\) together with the don't-care conditions \(d\) : (a) \(F(A, B, C, D)=\Sigma m(0,1,7,13,15), d(A, B, C, D)=\Sigma m(2,6,8,9,10)\) (b) \(F(W, X, Y,...
-
+Apply the simplified Espresso algorithm to the following function. Show a K-map for each algorithm routine that changes one or more implicants. \[F(A, B, C, D)=\bar{A} \bar{B} \bar{D}+\bar{B}...
-
Illustrate the expansion or reduction performed on each implicant on a Kmap if the operation changes the implicant. (a) Apply the Espresso EXPAND routine to the following function. \[F(A, B, C,...
Study smarter with the SolutionInn App