

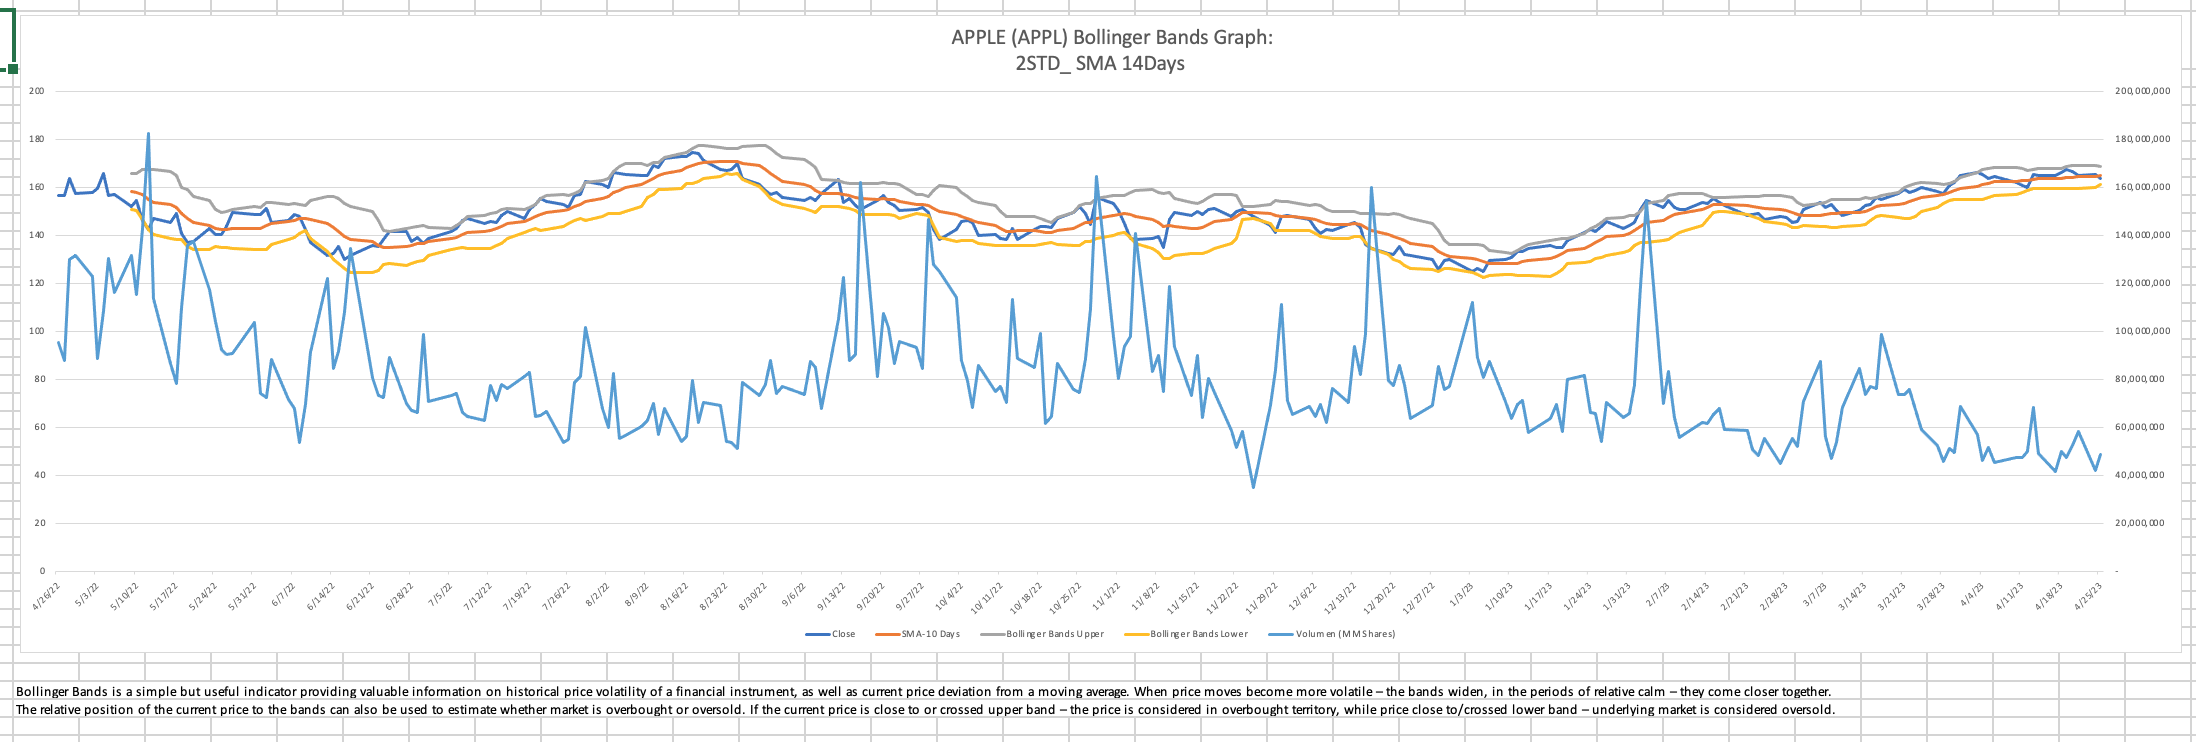
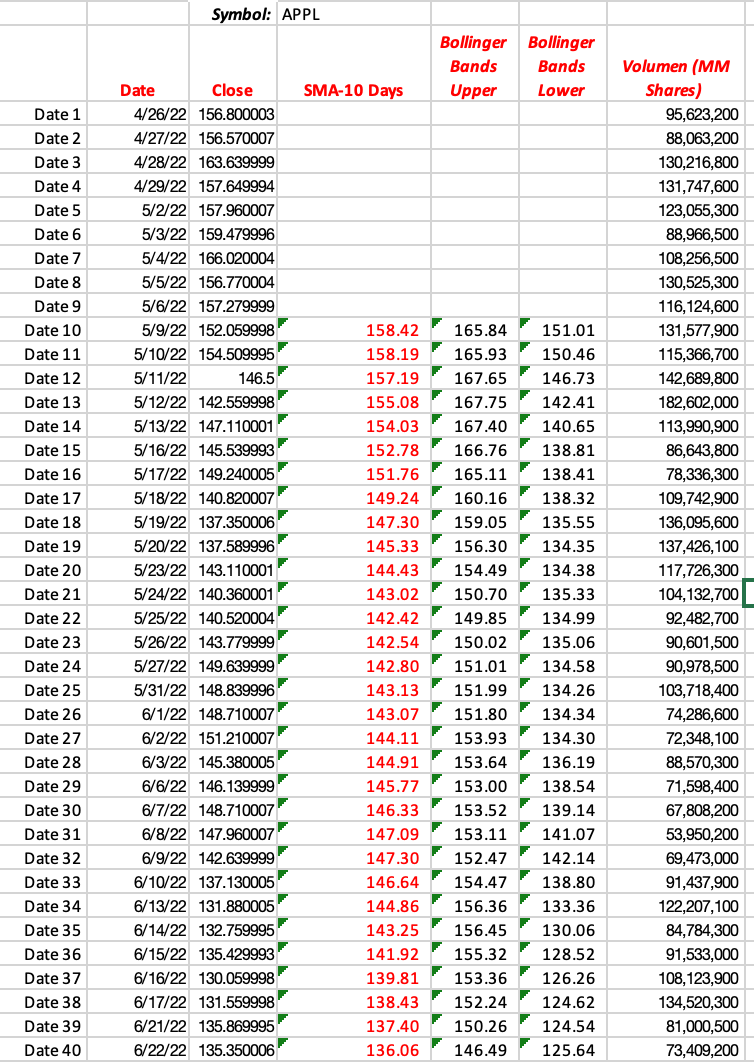
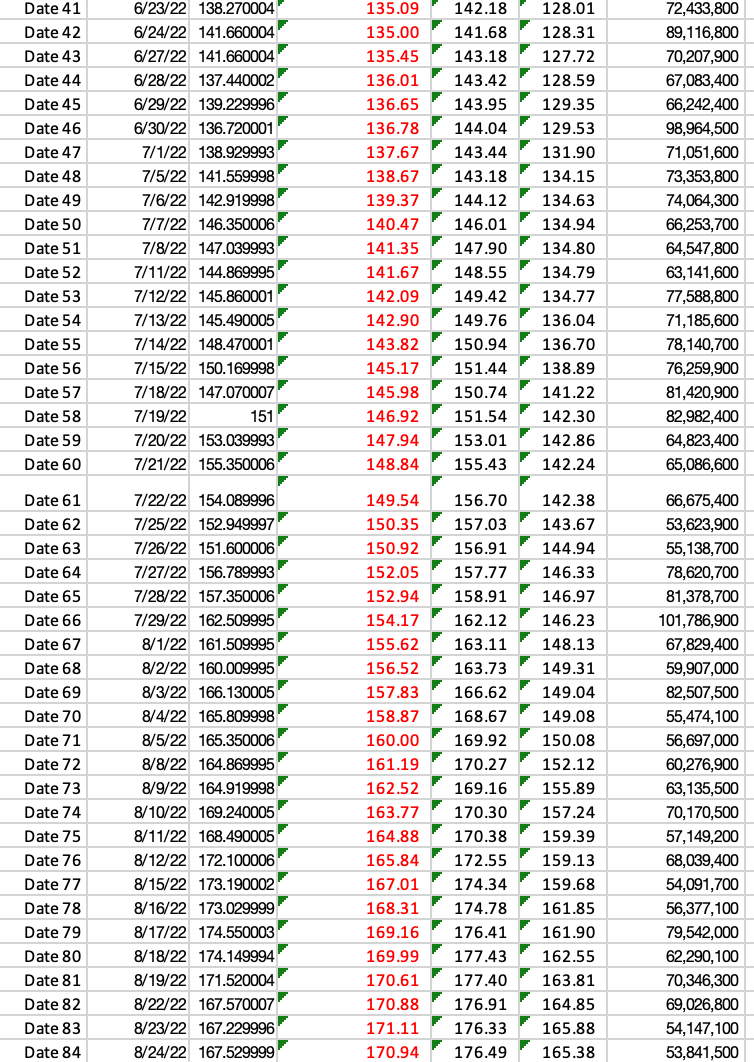
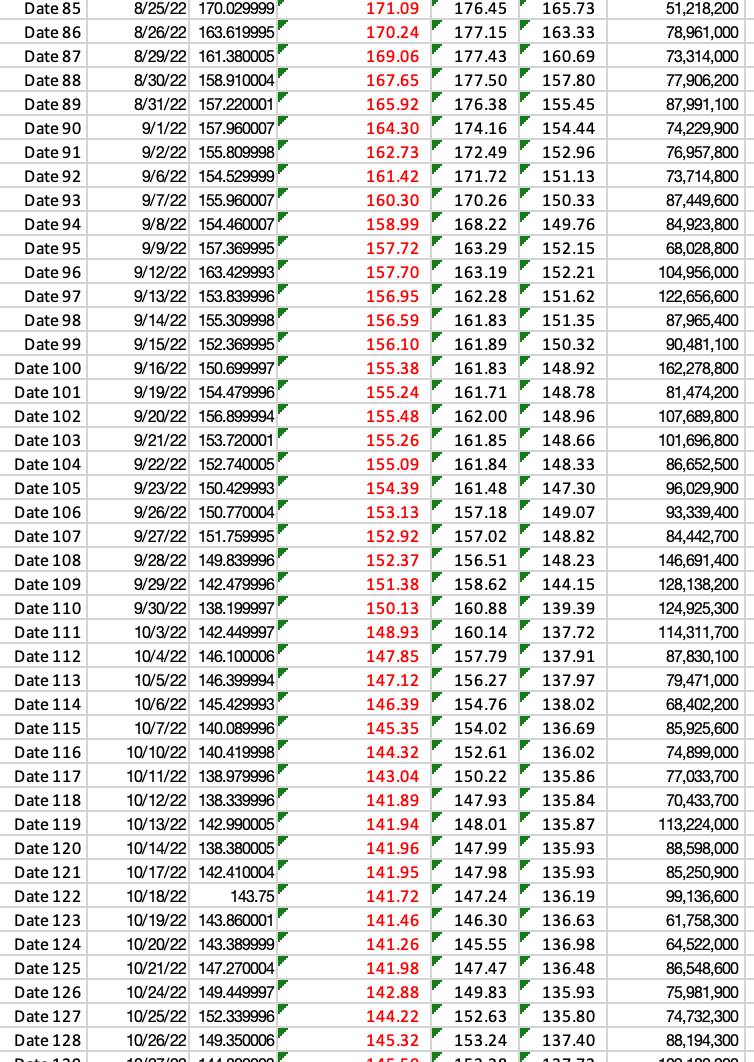
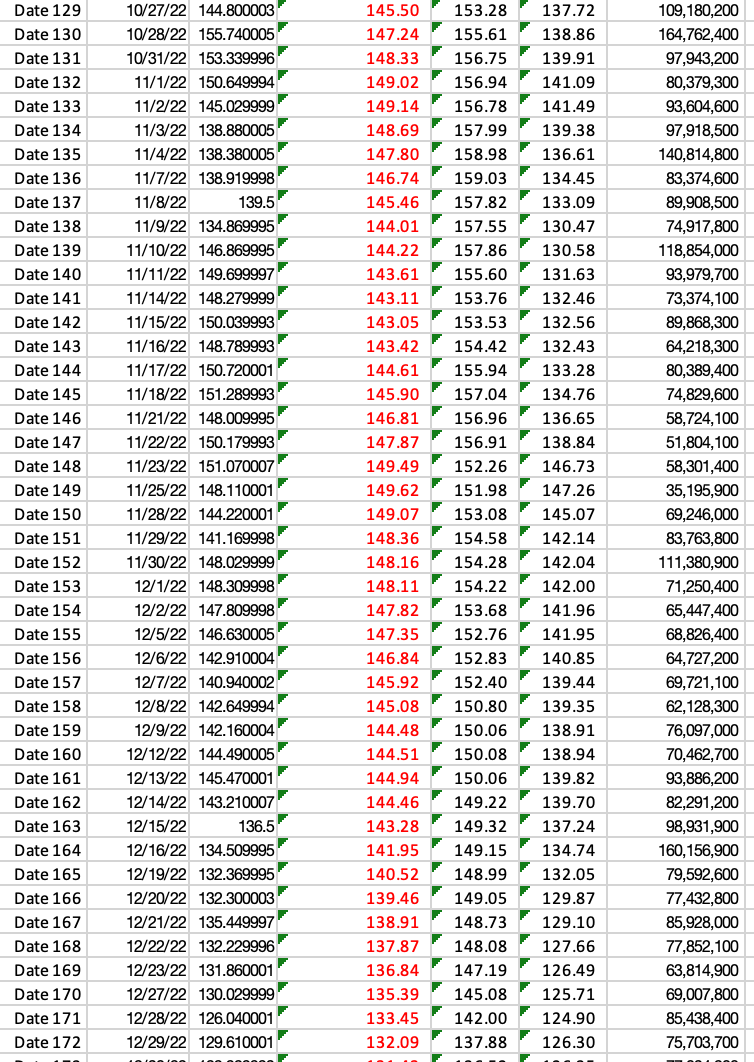
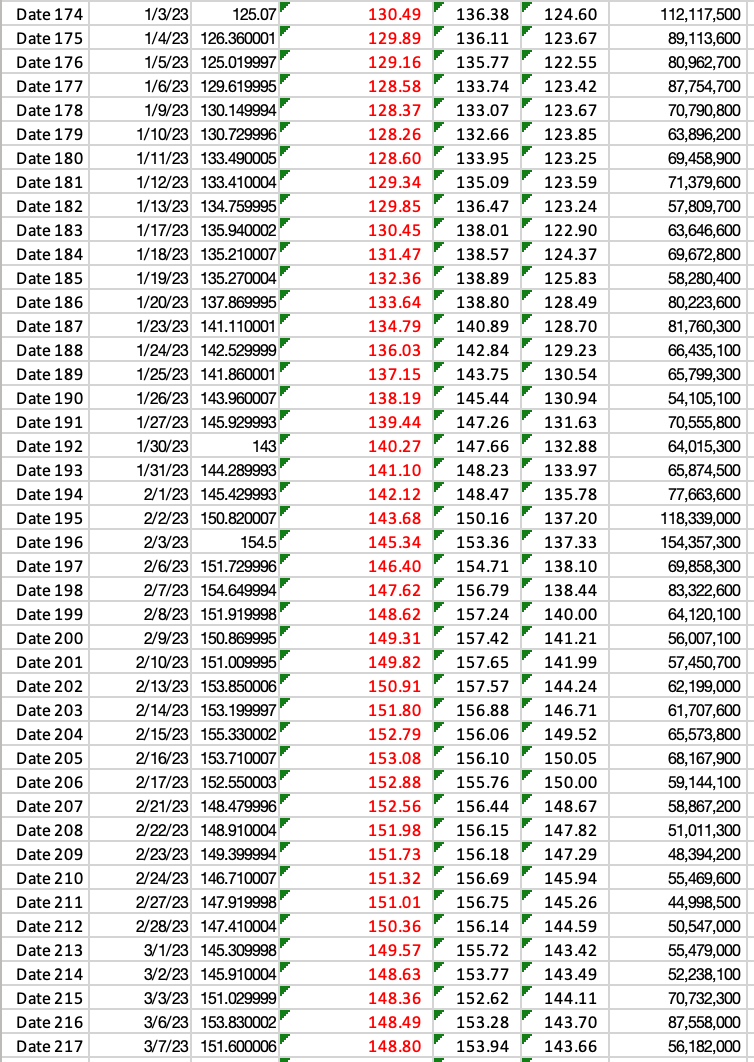
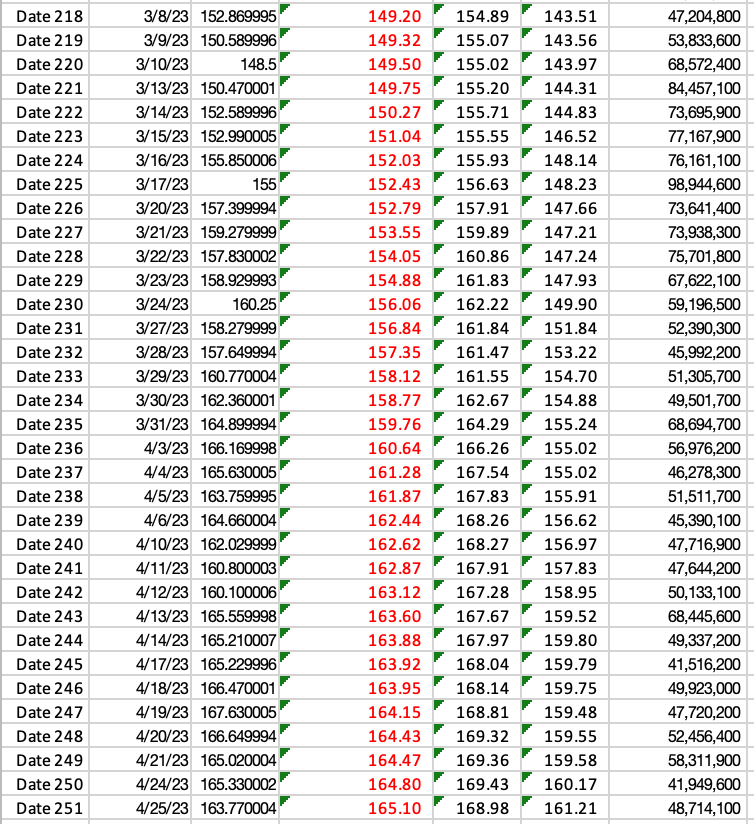
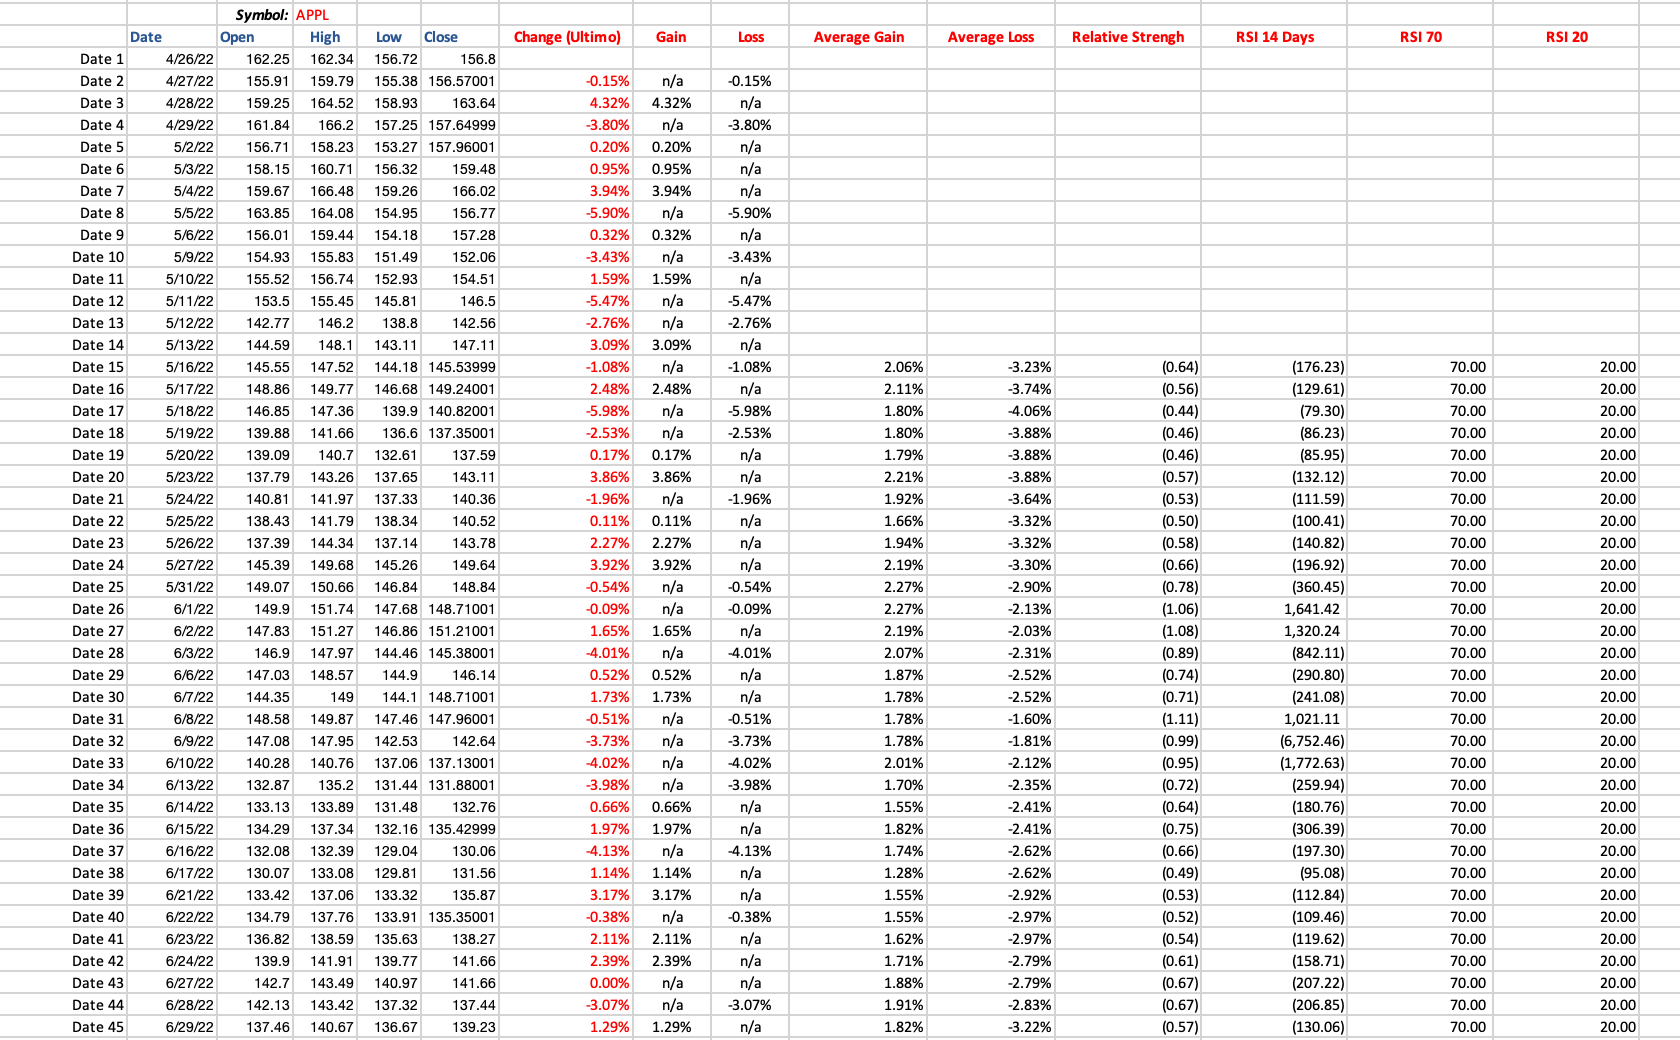
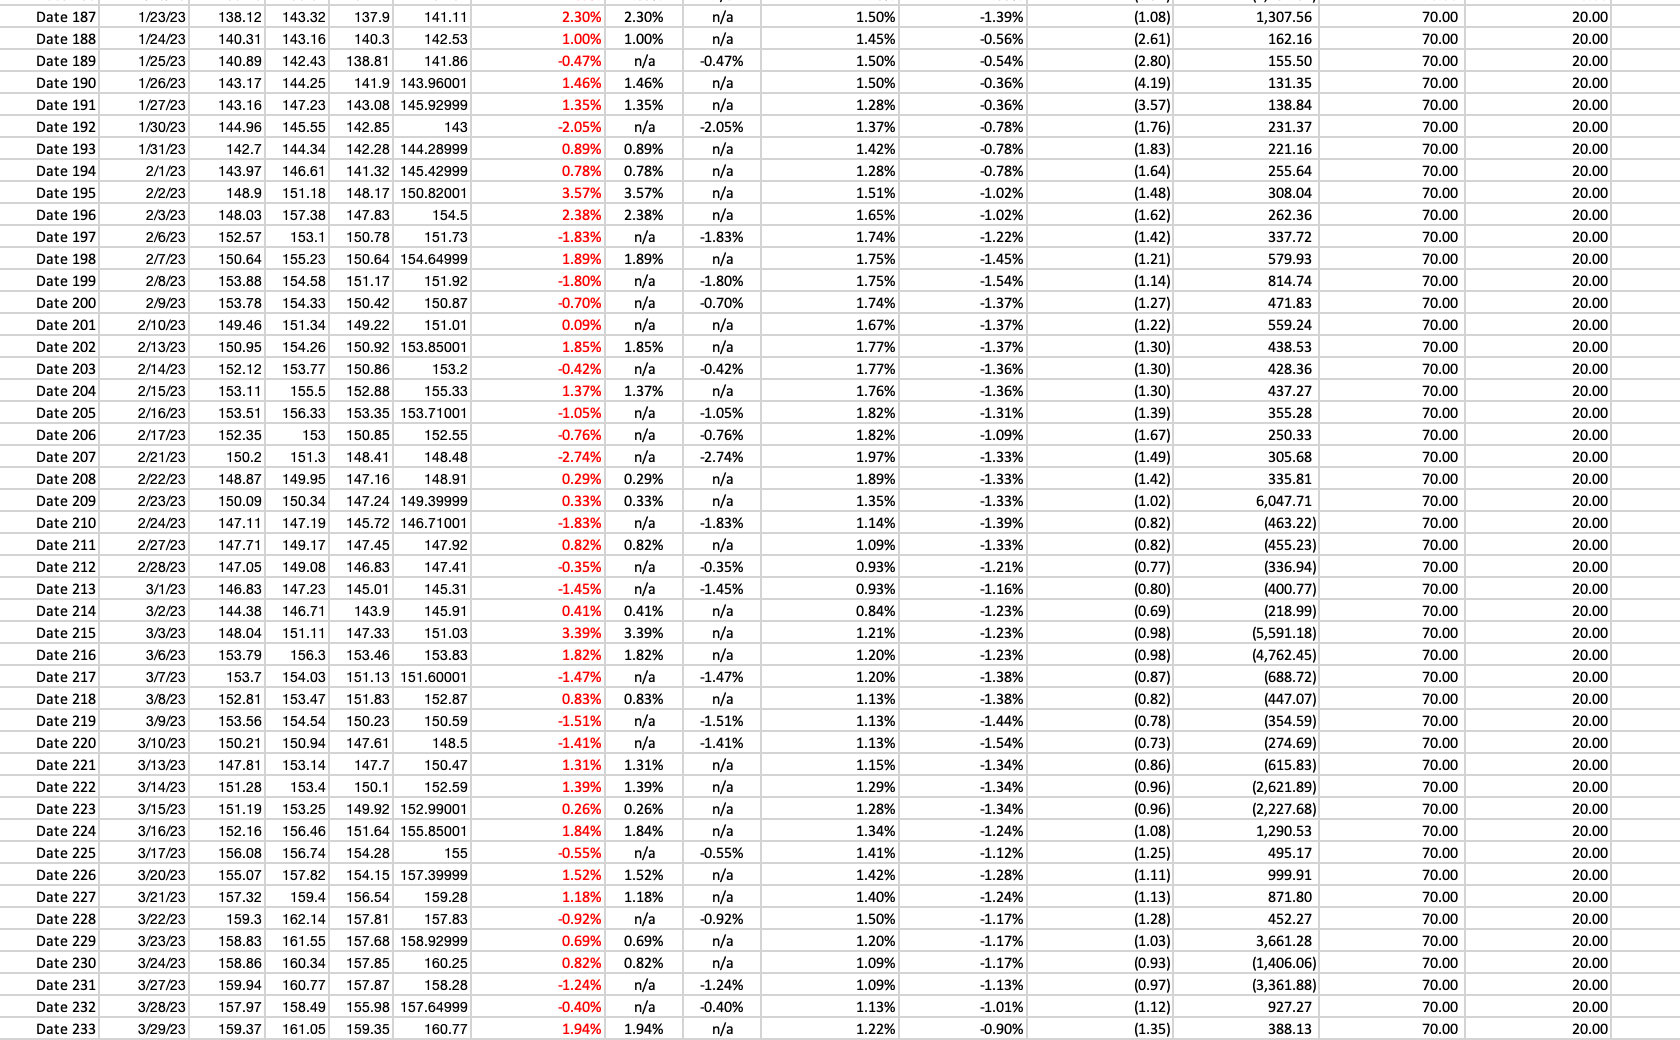
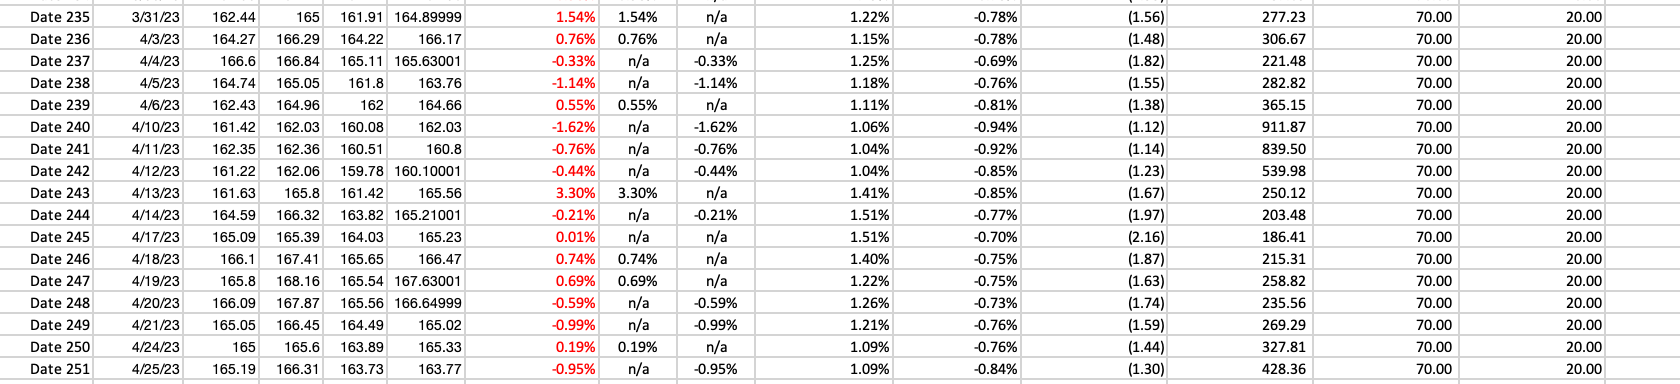
Using the Bollinger Bands chart The dates you could have bought the stock at the lowest possible
Fantastic news! We've Found the answer you've been seeking!
Question:
Using the Bollinger Bands chart The dates you could have bought the stock at the lowest possible price. The dates you could have sold the stock at the highest possible price. The behavior of the volume of shares sold. When the volume increased, what effect did it have on the price? When the volume dropped, what effect did it have on the price?
Expert Answer:

Related Book For 
Financial Accounting Tools for Business Decision Making
ISBN: 978-1119368458
7th Canadian edition
Authors: Paul D. Kimmel, Jerry J. Weygandt, Donald E. Kieso, Barbara Trenholm, Wayne Irvine
Posted Date:
