

Using the data on the 'data' tab, construct a scatterplot that compares the age and weight variables
Question:
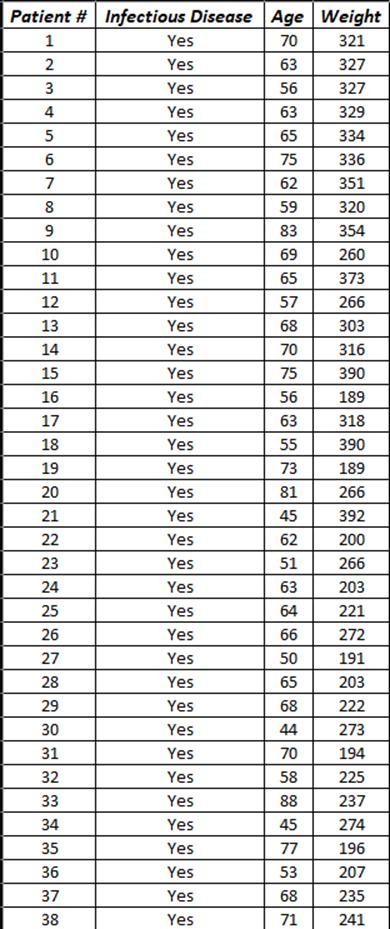
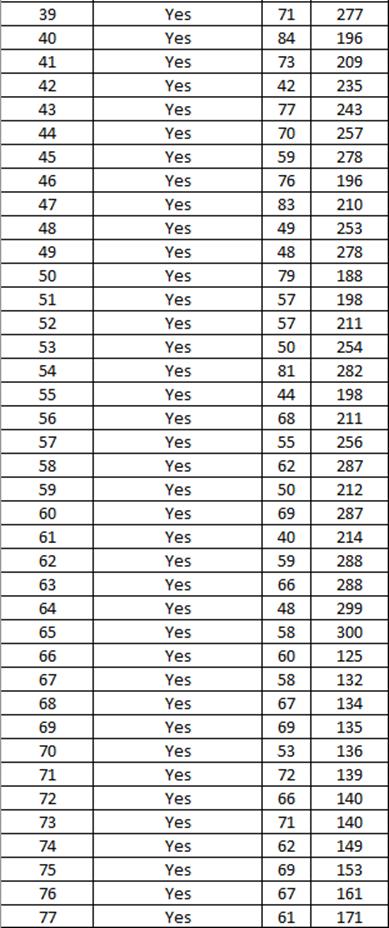
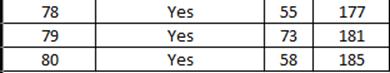
Using the data on the 'data' tab, construct a scatterplot that compares the age and weight variables in the space below. Let the age be the 'x' variable and weight be the 'y' variable. In the scatterplot, include at least the ax's names and the title of the graph.
7b. Describe the scatterplot above. Identify the two variables and any correlation that you observe in the scatterplot above. Explain your answer.
7c. Calculate the value of the linear correlation coefficient r and the critical value of r using α = 0.05. Show your calculations for r below. Include an explanation on how you found the critical value.
7d. Determine whether there is sufficient evidence to support the claim of a linear correlation between the weight and age of those individuals admitted to the hospital with this infectious disease. Explain your answer.
7e. Find the regression equation. Let the predictor (x) variable be the age. Identify the slope and the y-intercept within your regression equation.
Show your calculations below. Describe how you constructed the regression equation.
7f. Is the equation a good model? Explain your answer.
7g. What would be the best-predicted weight of a patient who was 80 years of age? Include the correct units.
Show your calculations below. Explain how you determined your answer.
Expert Answer:
Solution Since the given data we have the excel output of regression analysis is SUMMARY OUTPUT Regression Statistics Multiple R 0050163241 R Square 0002516351 Adjusted R Square 0010271901 Standard Er... View the full answer


Applied Regression Analysis and Other Multivariable Methods
ISBN: 978-1285051086
5th edition
Authors: David G. Kleinbaum, Lawrence L. Kupper, Azhar Nizam, Eli S. Rosenberg
