

Using the following sample results (50 items in each sample), calculate the requested questions a. What are
Fantastic news! We've Found the answer you've been seeking!
Question:
Using the following sample results (50 items in each sample), calculate the requested questions
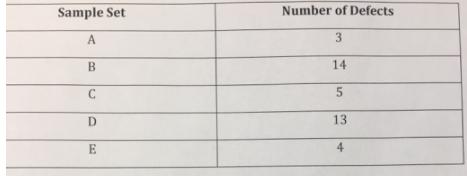
a. What are the three-sigma control limits (upper and lower) for the appropriate p-Chart?
b. Does the process appear to be in control? Explain.
Expert Answer:

Related Book For 

Posted Date:
