

The following graph shows two known points (X and Y) on a demand curve for oranges. 1.According
Fantastic news! We've Found the answer you've been seeking!
Question:
The following graph shows two known points (X and Y) on a demand curve for oranges.
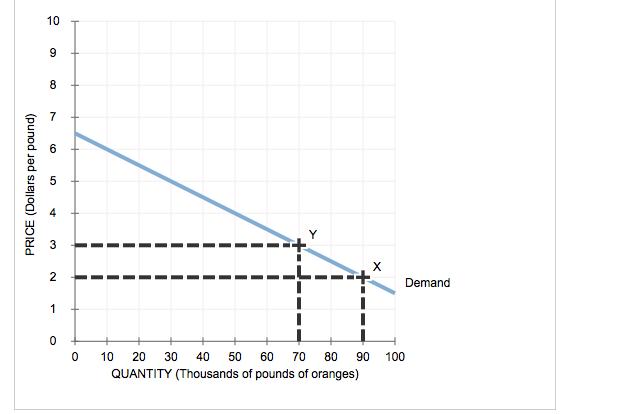
1.According to the midpoint method, the price elasticity of demand for oranges between point X and point Y is approximately (0.03, 0.05, 0.63, 1.6) , which suggests that the demand for oranges is (elastic, inelastic)between points X and Y.
Expert Answer:

Related Book For 
Posted Date:
